May 11, 2021
Threshold Analysis - Level of Detail Expressions vs. Table Calculations
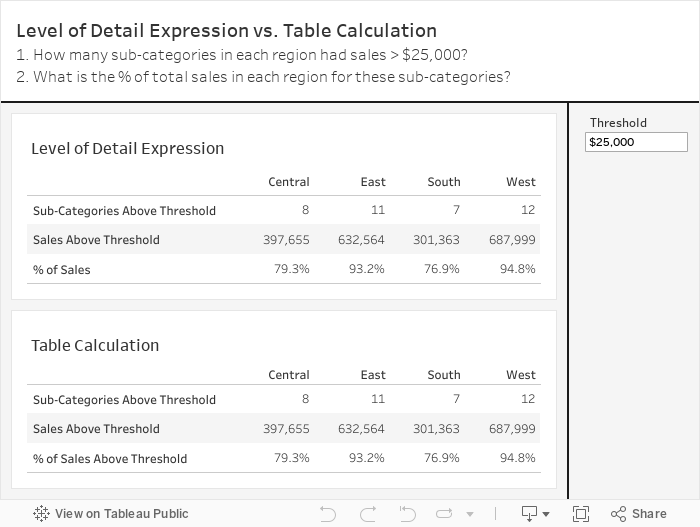
DS22 is nearing the end of their training and today was a bit of a refresher. One of the questions I wanted them to answer was how many sub-categories in each region had sales above $40,000?
We then expanded that to include (1) the sales for those sub-categories and (2) the % of sales those sub-categories make up of the region sales. They were to complete this using LODs.
As they worked on the task, I thought that this, for sure, could be done with table calculations. This is perfect for the Data School Gym.
If you know me, you know I love table calculations. And if you know Lorna Brown, you'll know she HATES table calculations. So this is your Data School Gym challenge Lorna.
Of course, everyone is welcome at the Data School Gym. It's actually not that hard and is a good way to help you learn about LODs vs. table calcs.
I'm not too fussed about making it look exactly the same. The point is to see if you can create the identical tables. Enjoy!


No comments
Post a Comment