December 8, 2021
#WOW2021 Week 45: Customer Purchasing Habits (RFM Analysis)

May 11, 2021
Threshold Analysis - Level of Detail Expressions vs. Table Calculations
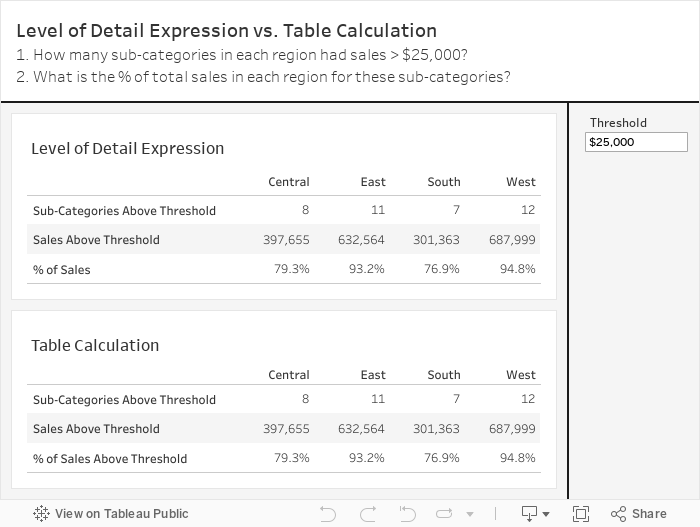
DS22 is nearing the end of their training and today was a bit of a refresher. One of the questions I wanted them to answer was how many sub-categories in each region had sales above $40,000?
We then expanded that to include (1) the sales for those sub-categories and (2) the % of sales those sub-categories make up of the region sales. They were to complete this using LODs.
As they worked on the task, I thought that this, for sure, could be done with table calculations. This is perfect for the Data School Gym.
If you know me, you know I love table calculations. And if you know Lorna Brown, you'll know she HATES table calculations. So this is your Data School Gym challenge Lorna.
Of course, everyone is welcome at the Data School Gym. It's actually not that hard and is a good way to help you learn about LODs vs. table calcs.
I'm not too fussed about making it look exactly the same. The point is to see if you can create the identical tables. Enjoy!

November 5, 2019
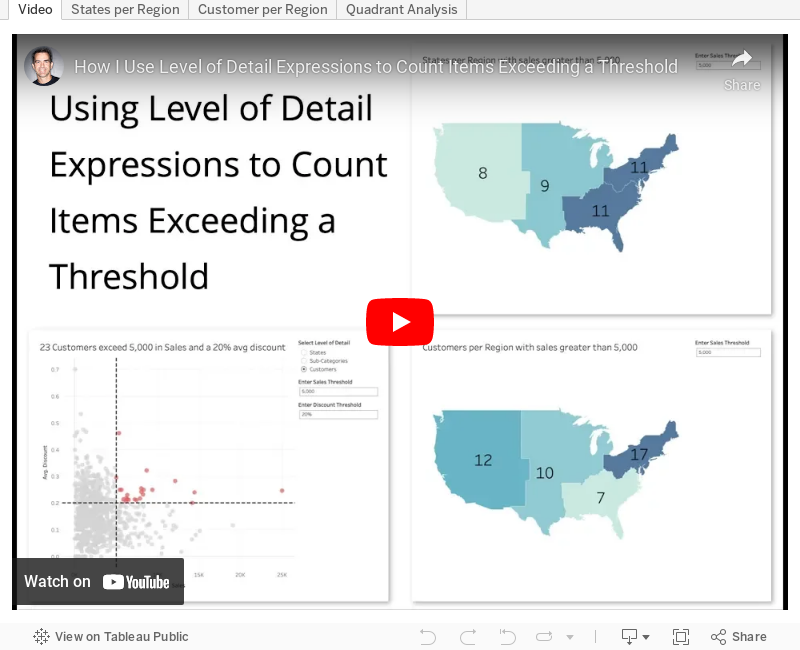
#TableauTipTuesday: Using Level of Detail Expressions to Count Items Exceeding a Threshold

I ended up babbling quite a bit as I created more examples; sorry for that, but I was on a roll.
April 4, 2017
Tableau Tip Tuesday: Using a LOD Expression to Count Customers Meeting a Sales Threshold
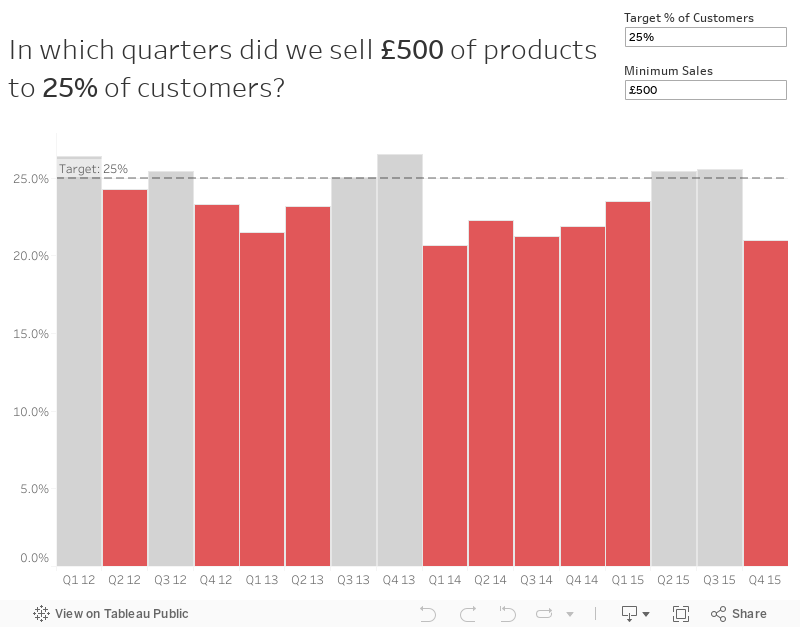
This post will walk through a pretty simple, but very applicable use case. Let's say you've set goals at your company that you want to sell £500 worth of products to each customer each quarter. But you also need that goal to be flexible. That is, the user needs to be able to change that amount.
First, we need to create a simple view that has Year and Quarter on the Columns shelf. I'm going to use continuous quarters.

Next, we need to create parameter to allow the user to enter the minimum threshold. To do that, I'll right click on Sales and choose Create -> Parameter. This automatically creates the parameter type that I need. I'm chose the All option in the Allowable values section because I want my user to be able to type in any value. I also set the Display format to currency.

Right click on your parameter and show the parameter control. The parameter doesn't do anything until I use it in a calculation. What we want to do now is create a level of detail expression to count the number of customers that met the threshold in each quarter. First, though, we need to determine the sale for each customer in each quarter. In a plain English sentence this would be:
For each customer, year and quarter, calculate their total sales.Since customer isn't in the view, that's our clue that we need to use a level of detail expression. The calculation looks like this:

Ok, now I need to determine how many customers met the threshold. To do this, I'm going to edit my calculation and add a simple IF statement.

This calc is looking at the sales for each customer in each quarter and if that customer meets the threshold, we count them. Otherwise, we don't count them. Dropping this into onto the Rows shelf, we now get a simple line chart.

As you change the parameter, every recalculates perfectly. Great! Now we know how many customers met the threshold each quarter. The problem now is that we don't have a lot of context. Is the 210 that met the £500 threshold in January good? Maybe we should have a secondary goal that X% of customers need to meet the target. In other words, 210 in January represents what percent of all customers?
To answer that we need to create another LOD expression to count the total customers.

One more calculation and we're nearly done. This time we want to calculate the % of customers that met the threshold.

Format this calculation to percentage (I like one decimal) and then replace the measure on the Rows shelf with this new calculation.


From here, I would create an additional calc that highlights the bars that are not meeting the threshold. Why? Because those are the areas of concern. The calculation looks like this:

Dropping that onto the color shelf and tweaking the colors, I now have a pretty complete view. The last thing I would do is adjust the format of my quarters and put it all together in a dashboard.