Showing posts with label fixed. Show all posts
April 29, 2021
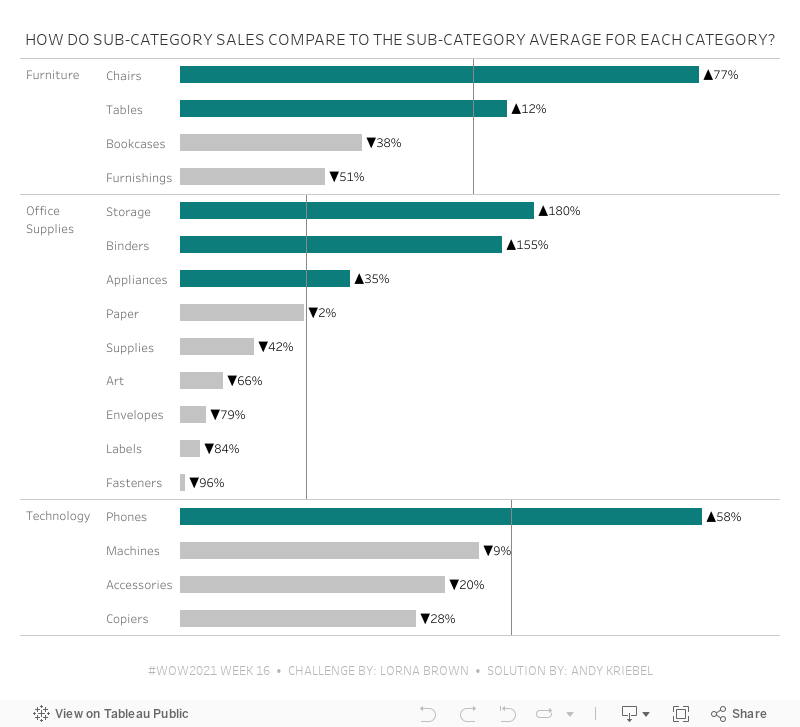
#WOW2021 Week 16 - How Do Sub-Category Sales Compare to the Sub-Category Average for Each Category?
bar chart
,
color
,
dual axis
,
fixed
,
gantt
,
level of detail
,
LOD
,
quick LOD
,
size
,
variance
,
Workout Wednesday
,
WOW2021
No comments

This workout required creating two quick LODs. So you have to think through the aggregations and adjust the default aggregation BEFORE creating the quick LOD. Here are my steps:
- Create a Quick LOD of Sales by Sub-Category by dropping Sales on top of Sub-Category (hold Command on a Mac while dropping). Since I left the default aggregation of Sales as SUM, this results in this LOD:
{ FIXED [Sub-Category]: SUM([Sales]) } - Change the default aggregation of this new field to average. You have to do this so that at the Category level, you're getting the average of the sales across the sub-categories in each Category.
- Again, create the Quick LOD by holding Command (Control on a PC) and dropping the calc created in step 1 on top of the Category field. This is the resulting calculation:
{ FIXED [Category]: AVG([Sales (Sub-Category)]) }
I'll leave the rest of the calcs to you. Good luck!
February 16, 2021
Understanding Table Calcs vs LODs: Explained with a Slope Graph
calculated field
,
comparison
,
compute by
,
difference
,
first
,
fixed
,
how to
,
last
,
LOD
,
lookup
,
slope graph
,
table calc
,
table calculation
,
tableau
,
tip
No comments

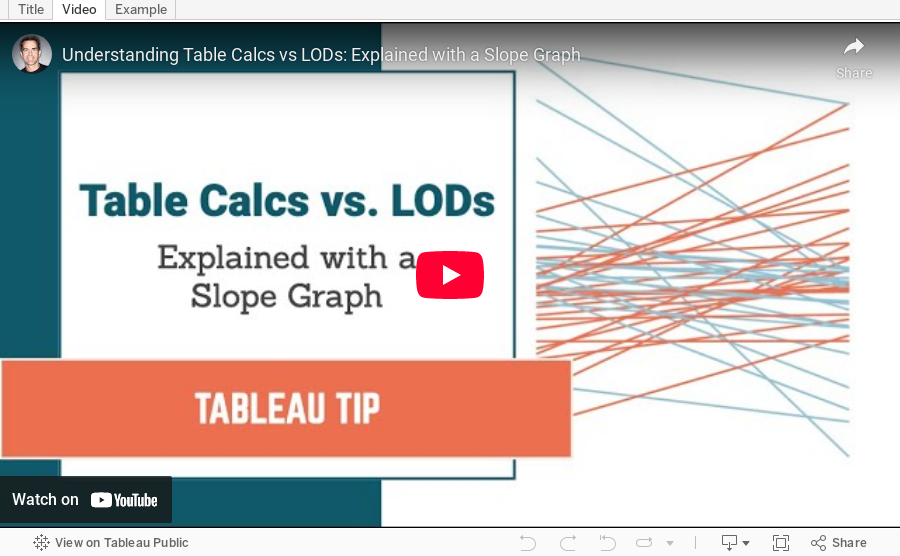
Table calculations and LODs, especially understanding the difference between when to use each, is one of the most difficult concepts to learn in Tableau. Through my time teaching, one of the most effective means for explaining the differences between them is with a simple slope graph.
The idea is to color each line of the slope graph by whether it represents an increase or a decrease. You'd think this would be super simple, but it's not. In this video, I show you:
1. How to write the required calculations
2. The benefits of table calcs vs. LODs
3. Why table calcs are often more flexible
My general rule of thumb: If all of the dimensions I need for the calculation I want to write are already in the view, start with a table calculation. If all of the dimensions I need are NOT in the view, then you must use a level of detail expression.
Download the sample data set here - https://data.world/vizwiz/car-sales-mock-data
September 11, 2018
Tableau Tip Tuesday: How to Conduct Market Share Analysis with Level of Detail Expressions
analysis
,
datetrunc
,
fixed
,
level of detail
,
LOD
,
market share
,
parameter
,
Tableau Tip Tuesday
No comments
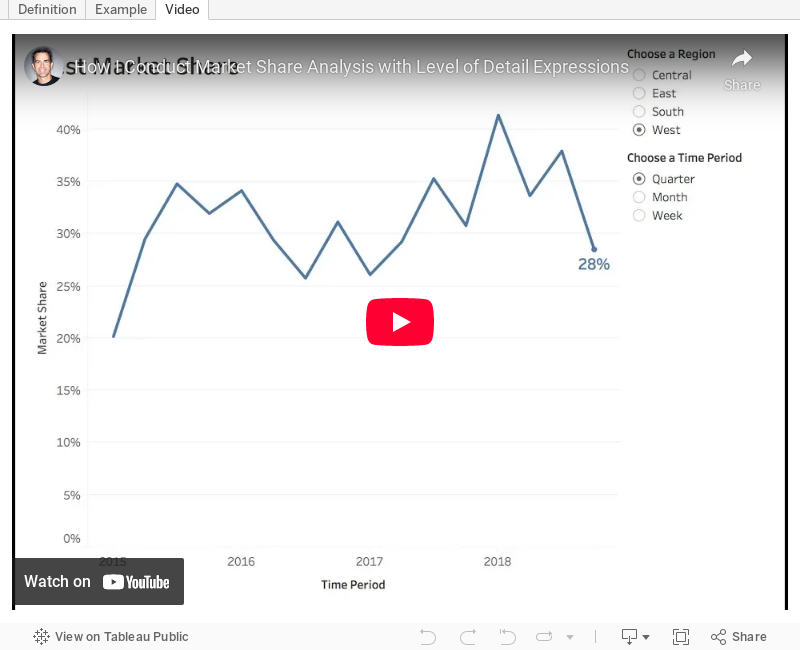
In this week's tip, I show you how to do market share analysis with Level of Detail expressions. In this video, I show you the calculations, then I expand it to make it more dynamic using a parameter.
Enjoy!

Enjoy!
May 9, 2017
Tableau Tip Tuesday: Using LOD Expressions to Color Lines By the Most Recent Value
date
,
fixed
,
latest
,
level of detail
,
line chart
,
LOD
,
most recent
,
nested
,
Tableau Tip Tuesday
2 comments
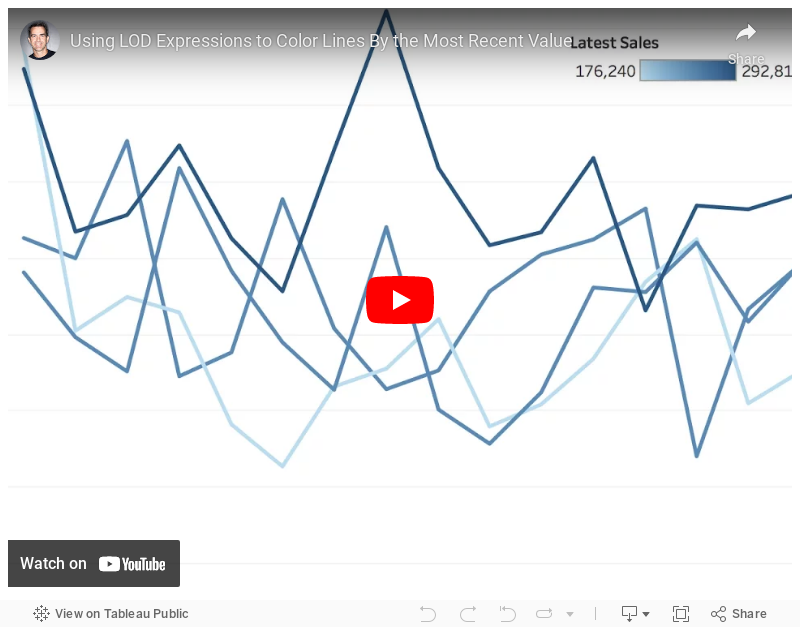
How can I color each line on a line chart by the most recent value?This requires a three-pass LOD expression. The key is to realize that Tableau created an aggregate table for each LOD working from the inside out. So
- Tableau calculates the inside LOD first.
- Then the second LOD is calculated based on the results of the first LOD.
- Then the third LOD is calculated based on the results of the second LOD.
Make sense? I hope so! If not, let me know. Enjoy!
May 2, 2017
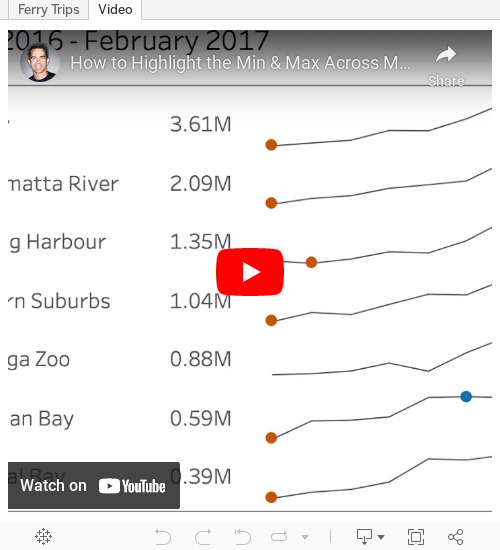
Tableau Tip Tuesday: How to Highlight the Min & Max Across Months with a Nested LOD
Charlie Hutcheson
,
fixed
,
highlight
,
indicator
,
level of detail
,
LOD
,
max
,
min
,
nested
,
Tableau Tip Tuesday
5 comments
Tiny #MakeoverMonday viz this week. One of my best mates goes on the Manly route as his daily commute. Lucky guy! https://t.co/WnxLuTYi1A pic.twitter.com/G3eBOCbg1F— Charlie Hutcheson (@CharlieHTableau) May 1, 2017
If you scroll through the comments, you'll see that Charlie was hoping to do this via LOD, but couldn't quite get it. My tip this week solves this problem.
Enjoy!
April 18, 2017
Tableau Tip Tuesday: FIXED Level of Detail Expressions in a Plain English Sentence

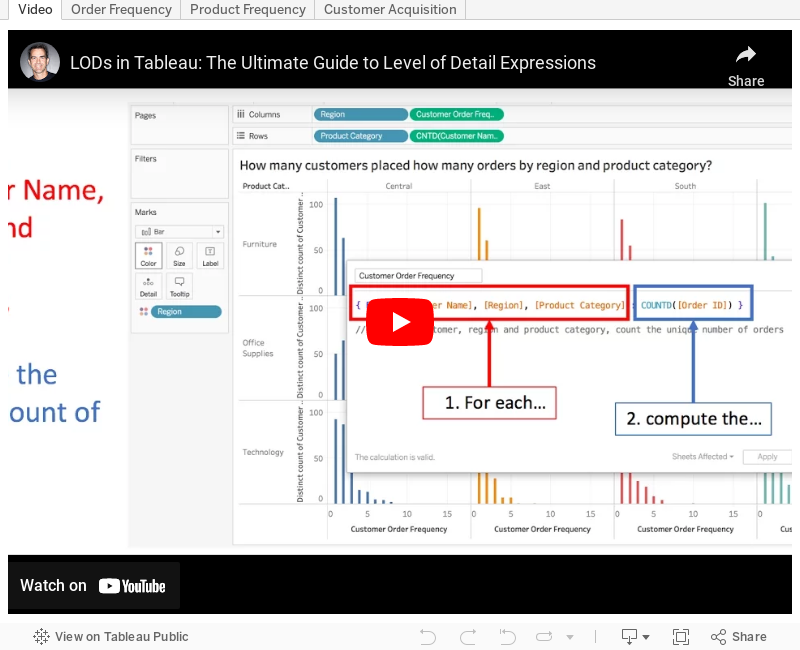
Back in February, I wrote about putting table calculations into an english sentence. This concept can be easily extended to level of detail expressions. As such, I'm going to kick off a series of blog posts that show how to take ANY level of detail expression and turn it into an english sentence.
First up are three use cases for FIXED LODs.
|
| How many customers placed how many orders by region and product category? |
 |
| How many products sell in how many regions by year and quarter? |
 |
| What is the total number of customers acquired by region by day? |
Here's a video of how I created each of the scenarios and the examples for you to download and follow along. Enjoy!
April 4, 2017
Tableau Tip Tuesday: Using a LOD Expression to Count Customers Meeting a Sales Threshold
calculated field
,
fixed
,
goal
,
level of detail
,
LOD
,
LOD calc
,
parameter
,
Tableau Tip Tuesday
,
target
,
threshold
7 comments
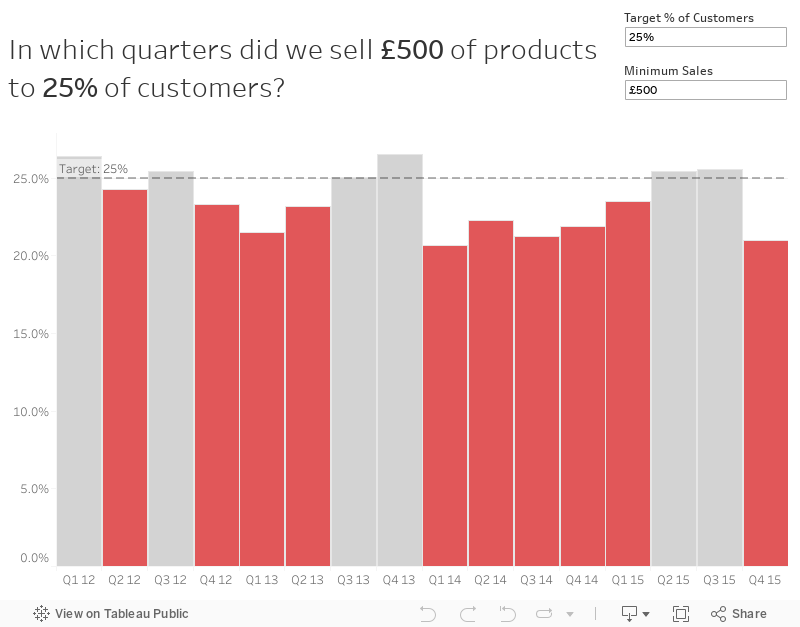
This post will walk through a pretty simple, but very applicable use case. Let's say you've set goals at your company that you want to sell £500 worth of products to each customer each quarter. But you also need that goal to be flexible. That is, the user needs to be able to change that amount.
First, we need to create a simple view that has Year and Quarter on the Columns shelf. I'm going to use continuous quarters.

Next, we need to create parameter to allow the user to enter the minimum threshold. To do that, I'll right click on Sales and choose Create -> Parameter. This automatically creates the parameter type that I need. I'm chose the All option in the Allowable values section because I want my user to be able to type in any value. I also set the Display format to currency.

Right click on your parameter and show the parameter control. The parameter doesn't do anything until I use it in a calculation. What we want to do now is create a level of detail expression to count the number of customers that met the threshold in each quarter. First, though, we need to determine the sale for each customer in each quarter. In a plain English sentence this would be:
For each customer, year and quarter, calculate their total sales.Since customer isn't in the view, that's our clue that we need to use a level of detail expression. The calculation looks like this:

Ok, now I need to determine how many customers met the threshold. To do this, I'm going to edit my calculation and add a simple IF statement.

This calc is looking at the sales for each customer in each quarter and if that customer meets the threshold, we count them. Otherwise, we don't count them. Dropping this into onto the Rows shelf, we now get a simple line chart.

As you change the parameter, every recalculates perfectly. Great! Now we know how many customers met the threshold each quarter. The problem now is that we don't have a lot of context. Is the 210 that met the £500 threshold in January good? Maybe we should have a secondary goal that X% of customers need to meet the target. In other words, 210 in January represents what percent of all customers?
To answer that we need to create another LOD expression to count the total customers.

One more calculation and we're nearly done. This time we want to calculate the % of customers that met the threshold.

Format this calculation to percentage (I like one decimal) and then replace the measure on the Rows shelf with this new calculation.


From here, I would create an additional calc that highlights the bars that are not meeting the threshold. Why? Because those are the areas of concern. The calculation looks like this:

Dropping that onto the color shelf and tweaking the colors, I now have a pretty complete view. The last thing I would do is adjust the format of my quarters and put it all together in a dashboard.
Subscribe to:
Posts
(
Atom
)






