April 29, 2021
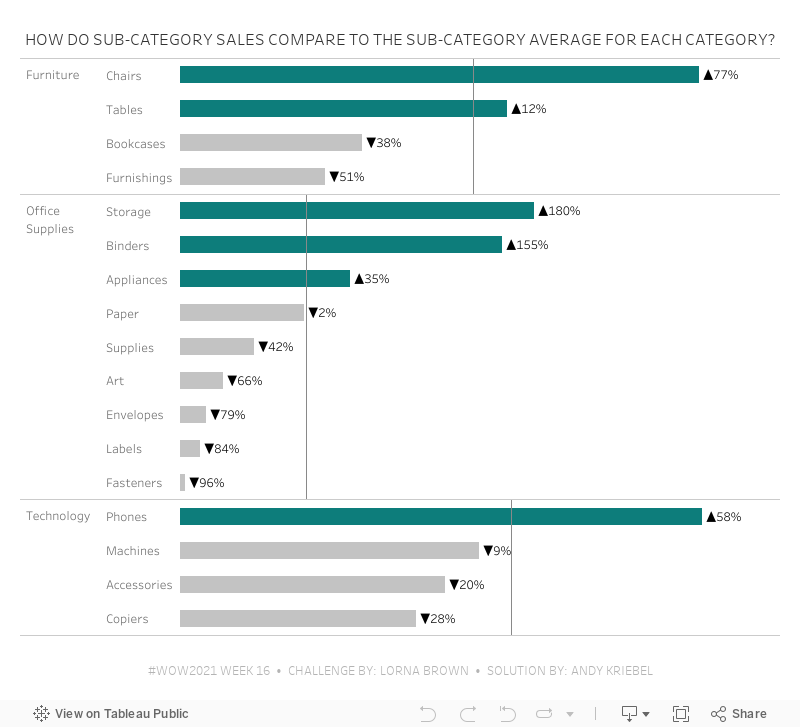
#WOW2021 Week 16 - How Do Sub-Category Sales Compare to the Sub-Category Average for Each Category?
bar chart
,
color
,
dual axis
,
fixed
,
gantt
,
level of detail
,
LOD
,
quick LOD
,
size
,
variance
,
Workout Wednesday
,
WOW2021
No comments

This workout required creating two quick LODs. So you have to think through the aggregations and adjust the default aggregation BEFORE creating the quick LOD. Here are my steps:
- Create a Quick LOD of Sales by Sub-Category by dropping Sales on top of Sub-Category (hold Command on a Mac while dropping). Since I left the default aggregation of Sales as SUM, this results in this LOD:
{ FIXED [Sub-Category]: SUM([Sales]) } - Change the default aggregation of this new field to average. You have to do this so that at the Category level, you're getting the average of the sales across the sub-categories in each Category.
- Again, create the Quick LOD by holding Command (Control on a PC) and dropping the calc created in step 1 on top of the Category field. This is the resulting calculation:
{ FIXED [Category]: AVG([Sales (Sub-Category)]) }
I'll leave the rest of the calcs to you. Good luck!
Subscribe to:
Post Comments
(
Atom
)


No comments
Post a Comment