January 6, 2023
How to Create a Two Color Area Chart in Tableau
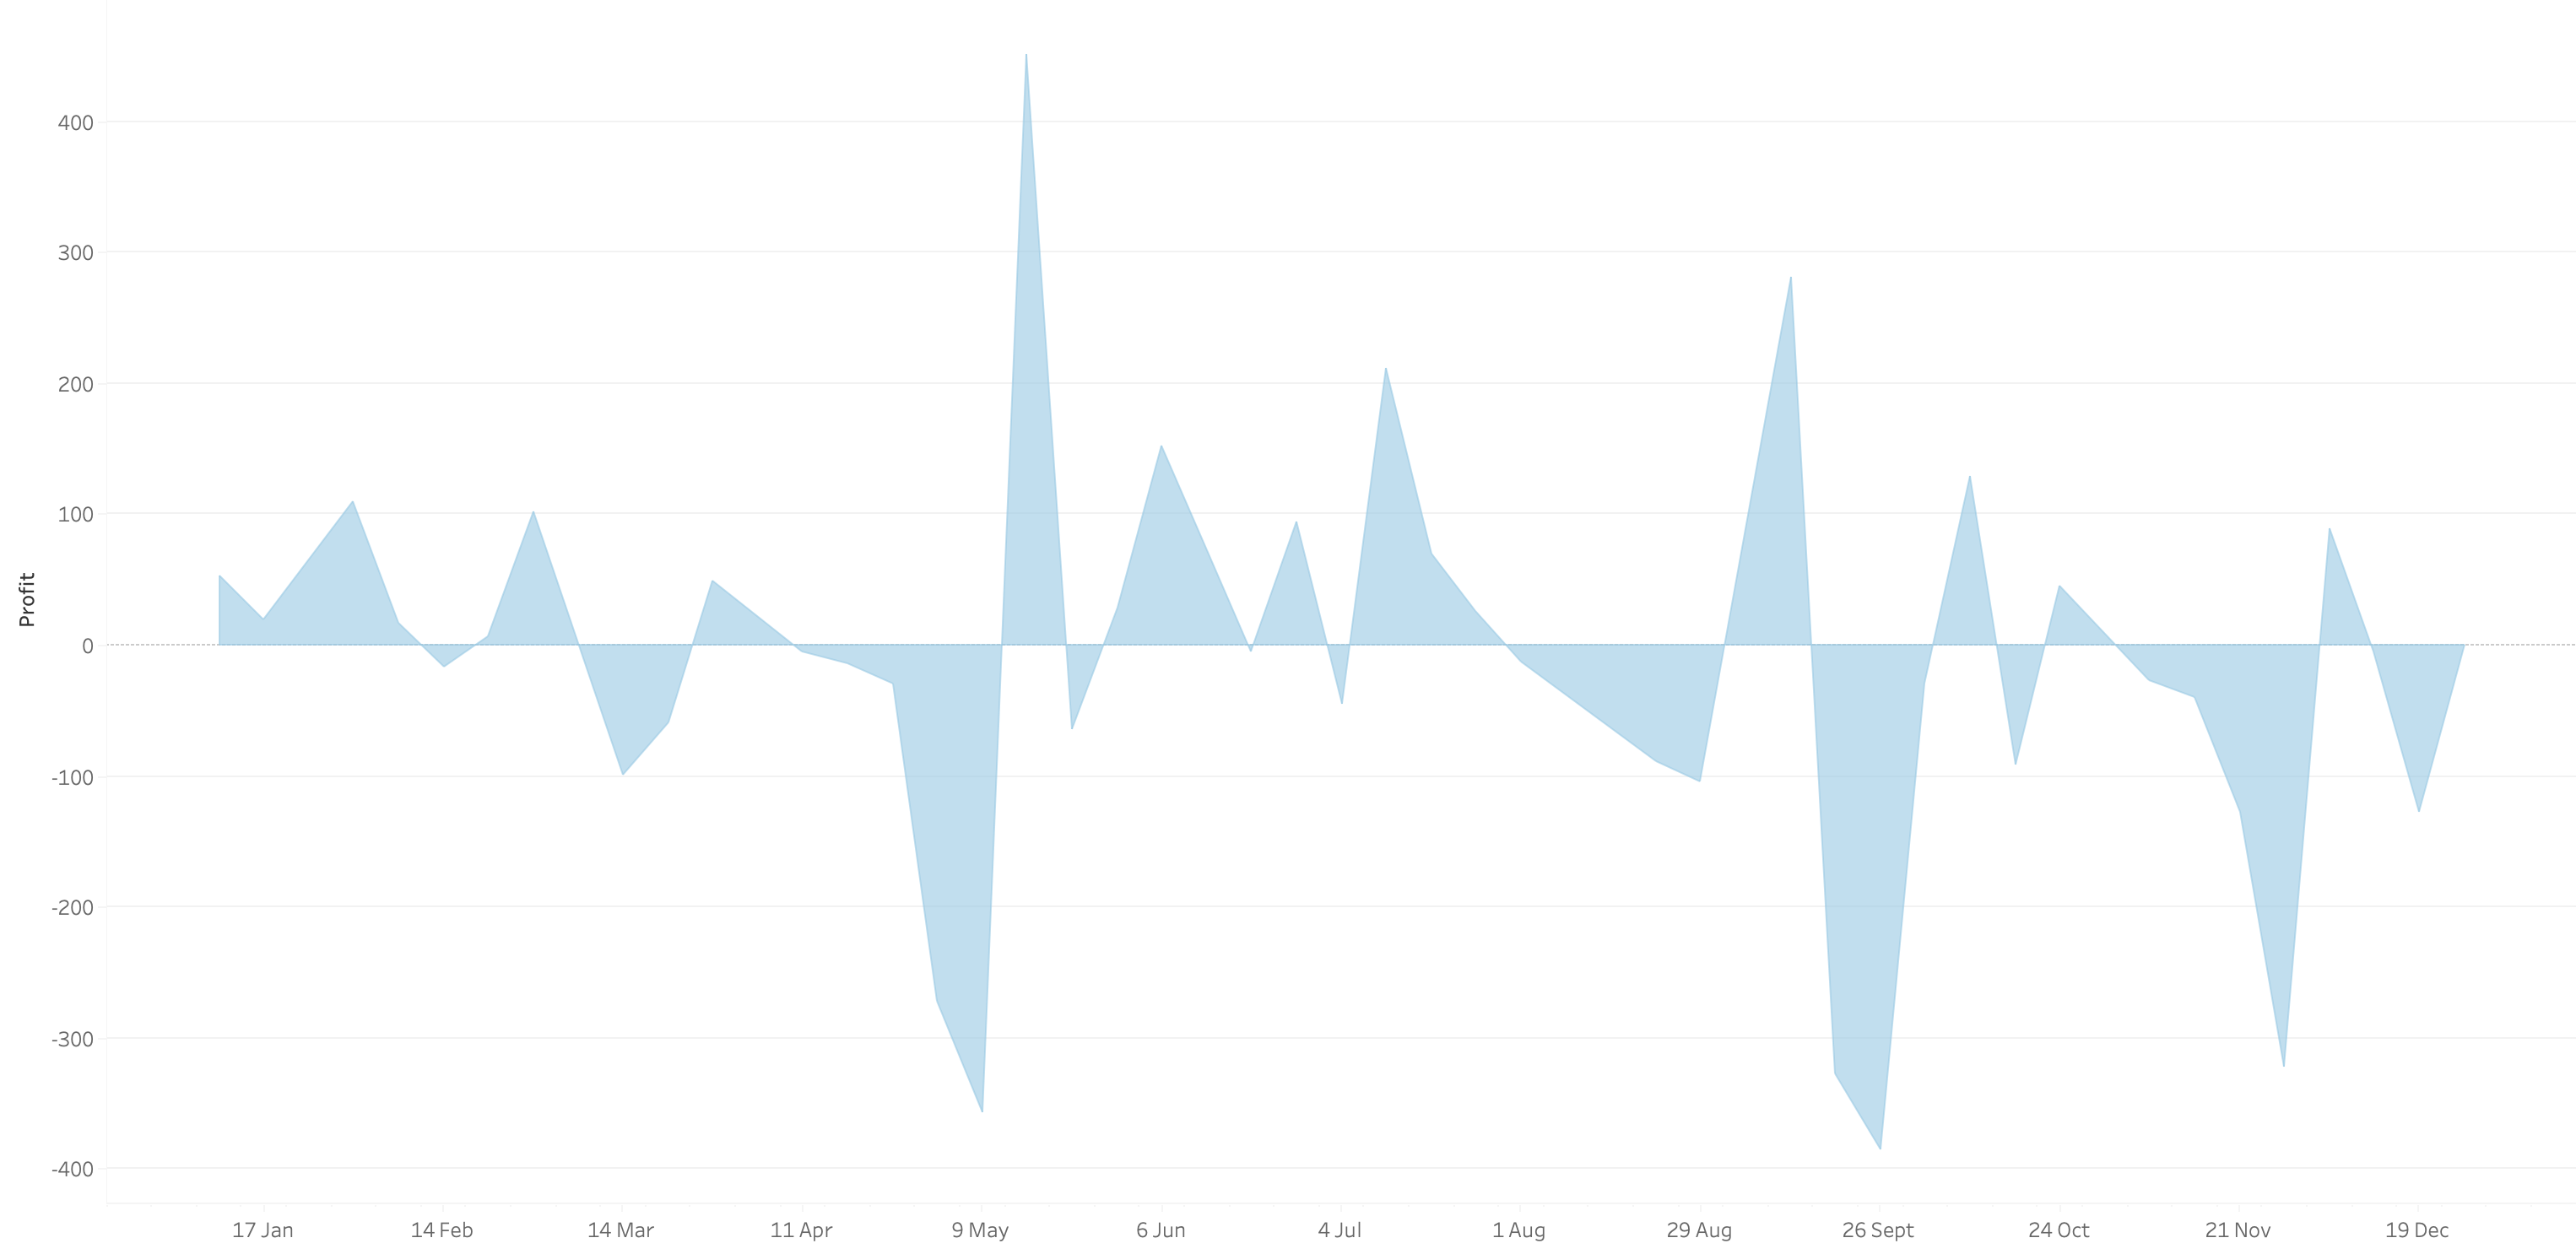
In this week's Watch Me Viz, I showed the problem this tip helps solve. An area chart in Tableau only allows a single color. Like this…
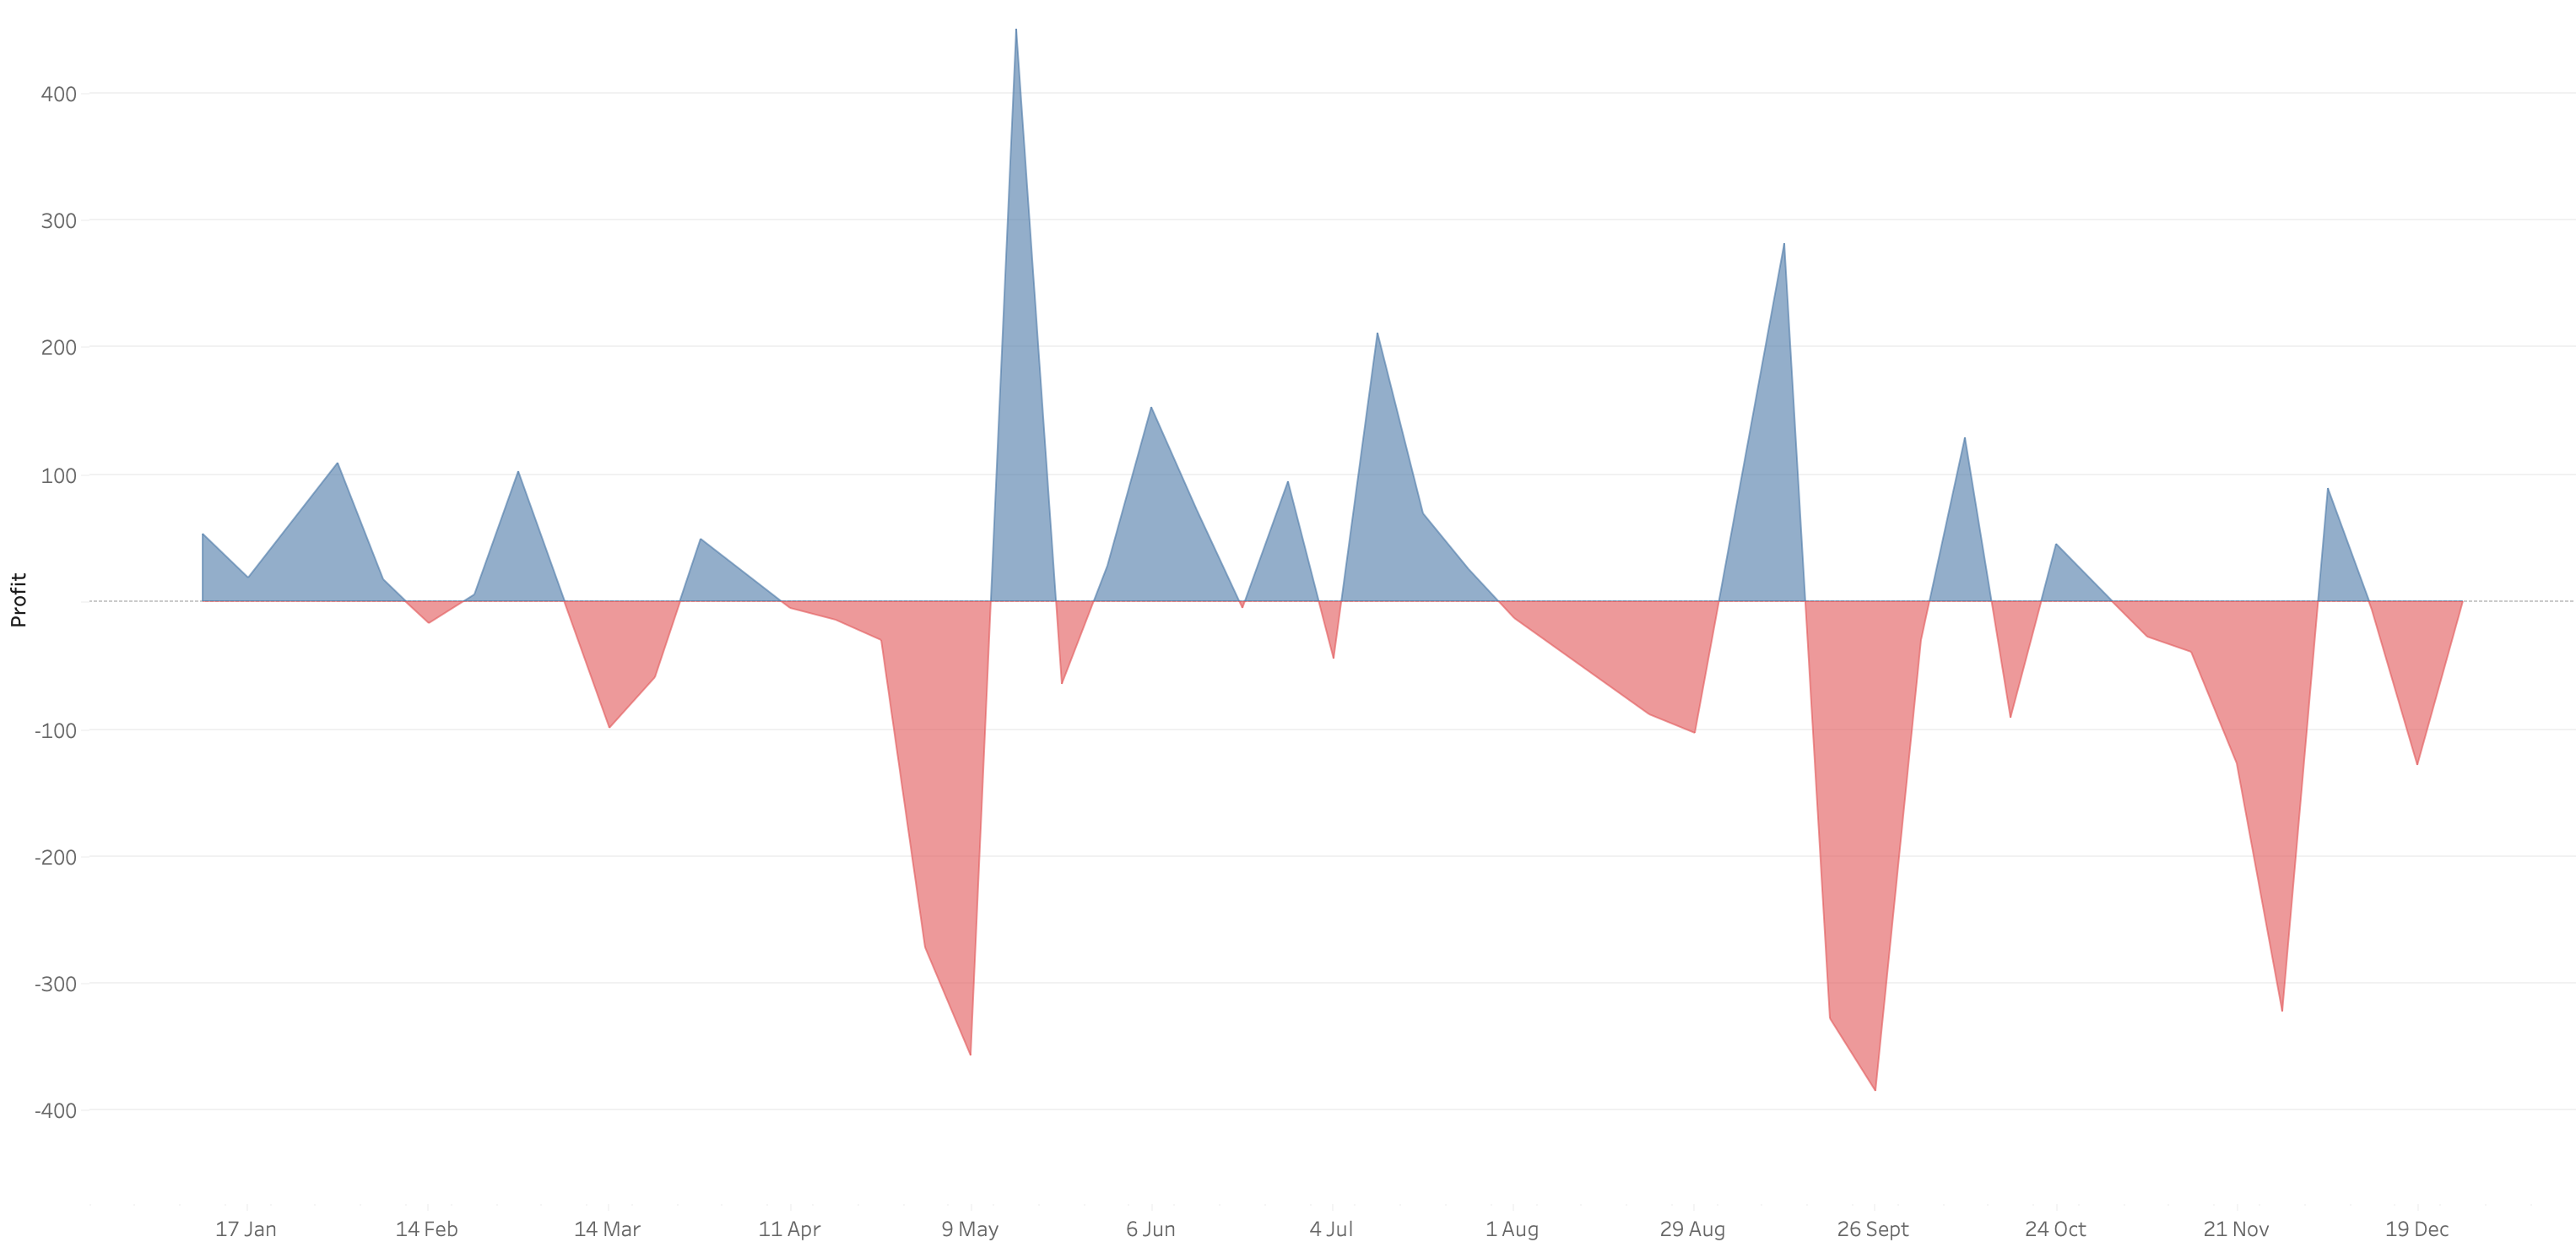
What we want is an area chart like this with two colors.
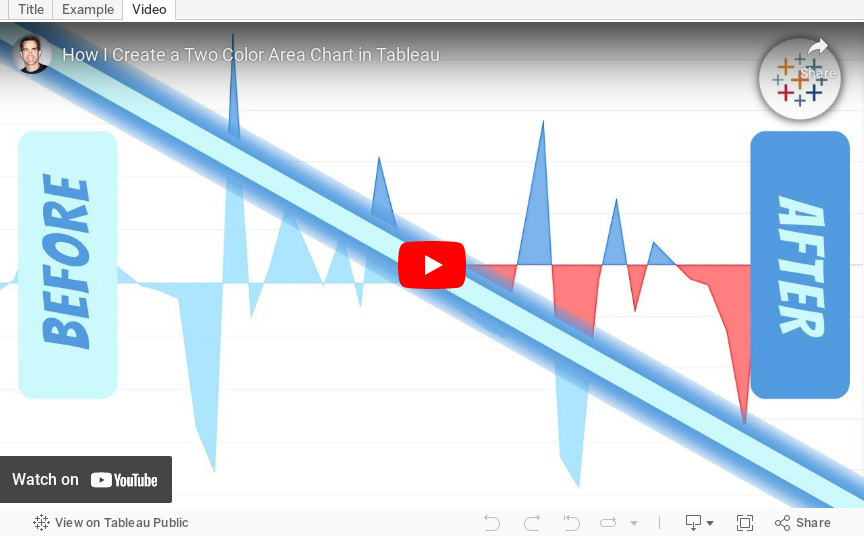
In 9 simple steps, I’ll show you how to build it. Follow along with the video. The 9 steps are listed at the bottom of this post.
STEPS
1. Create the area chart
2. Show what happens when you add a profit to color - you only get one color
3. Duplicate the measure
4. Fix the axes
1. Top axis starts at 0
2. Bottom axis ends at 0
5. Choose a color for each area chart
6. Format the axes to get rid of 0
7. Add reference lines to scale the charts relative to each other
1. WINDOW_MAX(ABS(SUM([Profit])))
8. Duplicate for the negative reference line
9. Formatting
May 2, 2017
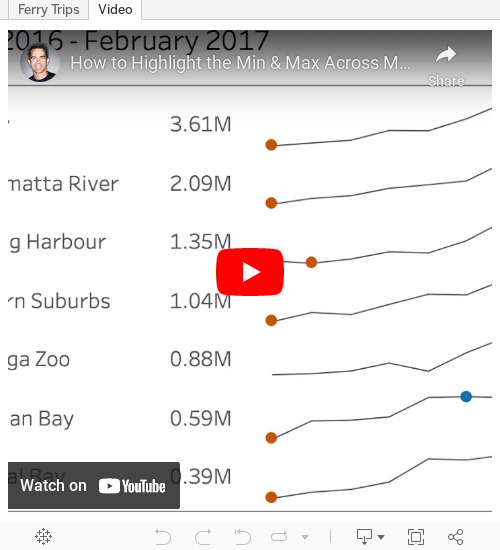
Tableau Tip Tuesday: How to Highlight the Min & Max Across Months with a Nested LOD
Tiny #MakeoverMonday viz this week. One of my best mates goes on the Manly route as his daily commute. Lucky guy! https://t.co/WnxLuTYi1A pic.twitter.com/G3eBOCbg1F— Charlie Hutcheson (@CharlieHTableau) May 1, 2017
If you scroll through the comments, you'll see that Charlie was hoping to do this via LOD, but couldn't quite get it. My tip this week solves this problem.
Enjoy!
February 22, 2017
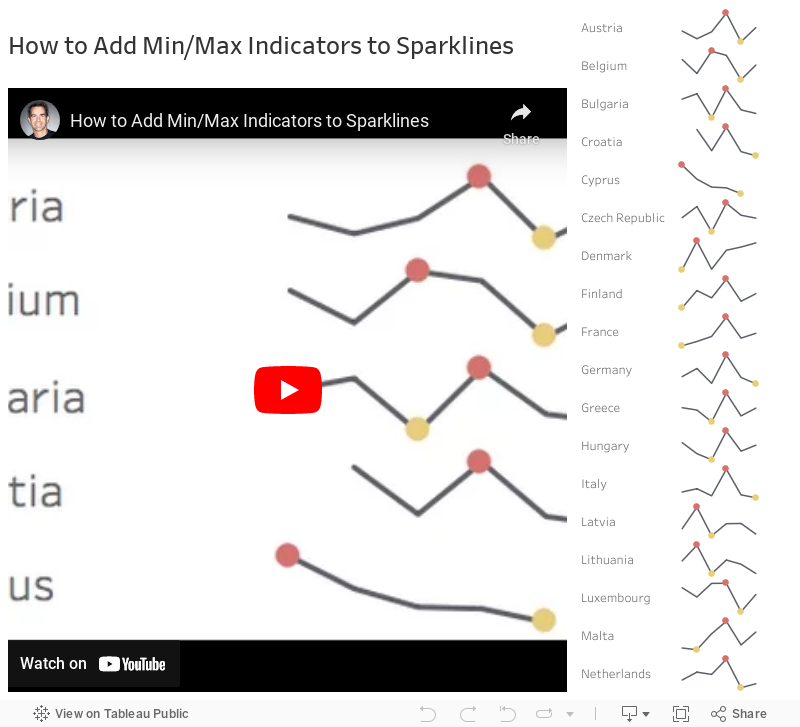
Tableau Tip Tuesday: How to Add Min/Max Indicators to Sparklines
First, let's have a quick look at Ann's viz:

Notice the sparklines with the indicators on the right. In this week's tip, I'll walk you through how I would go about creating those. The video is under five minutes and easily replicable. Enjoy!