Showing posts with label header. Show all posts
April 1, 2024
#WatchMeViz: Can viral infections be cured with antibiotics?
Americans
,
antibiotics
,
dot plot
,
dual axis
,
formatting
,
header
,
how to
,
KFF
,
Makeover Monday
,
stacked bar chart
,
survey
,
tableau
,
United States
,
USA
,
viral infections
,
WatchMeViz
No comments

I'm really surprised, though maybe I shouldn't be, about the results from a poll of 1206 Americans by KFF. They asked a simple question:
"Can viral infections usually be cured by antibiotcs, or not? Or do you not know enough to say?"
According to the results, women know better than men, as do adults with higher incomes and higher levels of education.
I took on this data set for Watch Me Viz for Makeover Monday week 14. Check out my final viz here. There's an image below the video.
September 21, 2021
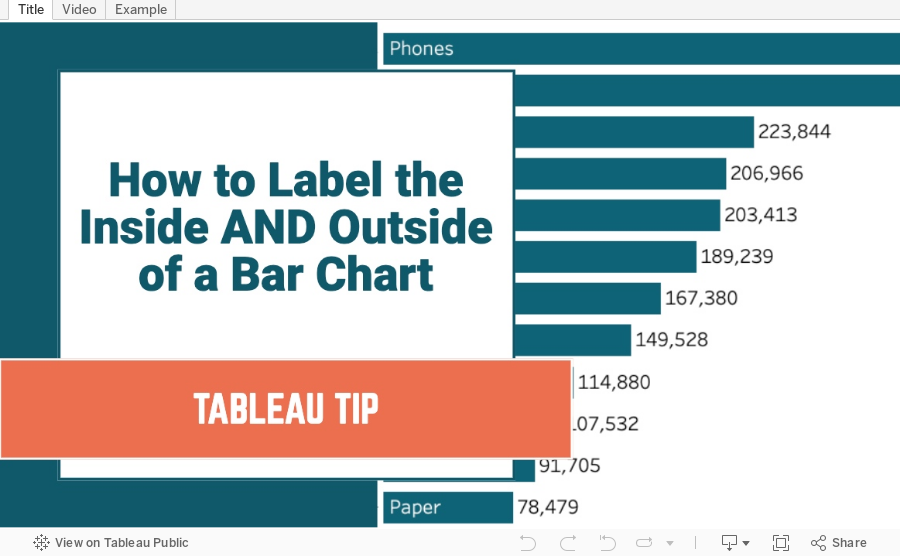
How to Label the Inside and Outside of a Bar Chart
bar chart
,
bar end
,
chart
,
formatting
,
graph
,
header
,
how to
,
inside
,
label
,
label shelf
,
outside
,
tableau
,
text
,
tip
No comments
July 6, 2021
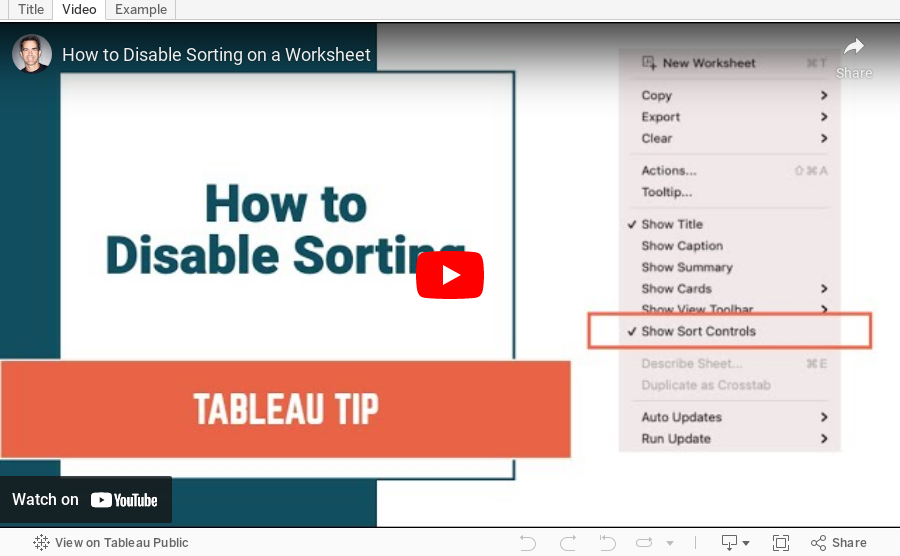
How to Disable Sorting on a Worksheet
axis
,
disable
,
header
,
menu
,
show sort controls
,
sort
,
sorting
,
tableau
,
tip
,
worksheet
No comments
It's quite simple! All you have to do is turn off the sort controls. In this short Tableau Tip, I show you how to do it. Enjoy!
June 23, 2021
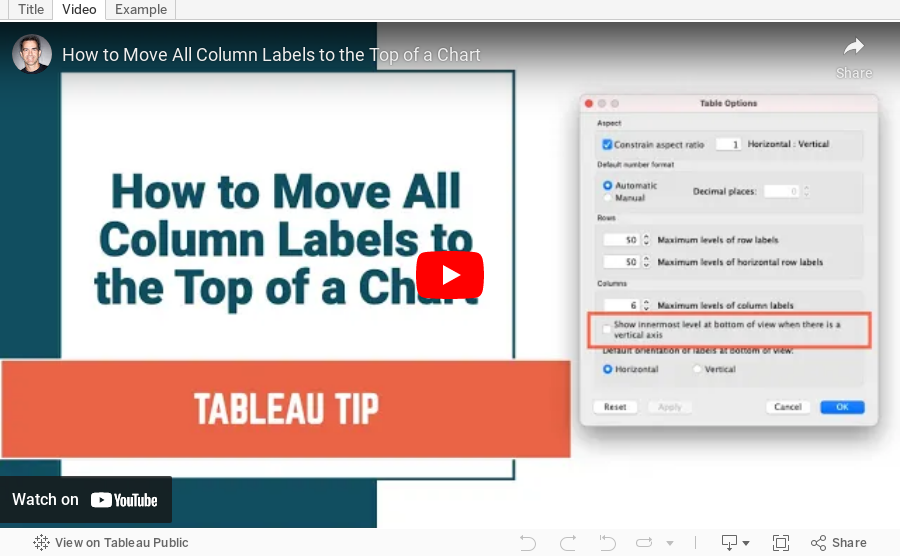
How to Move All Column Labels to the Top of a Chart
advanced settings
,
analysis
,
formatting
,
header
,
help
,
mark labels
,
move to top
,
table layout
,
tableau
,
tip
,
trick
,
tutorial
No comments
A very common frustration I hear is that Tableau can't move headers from the bottom of a chart to the top if there's more than one dimension.
In this tip, I'm going to show you how simple it is to move all discrete column labels to the top of a chart. Please keep in mind that this is a workbook level setting. Therefore, all charts in the workbook will show all discrete headers at the top.
November 17, 2020
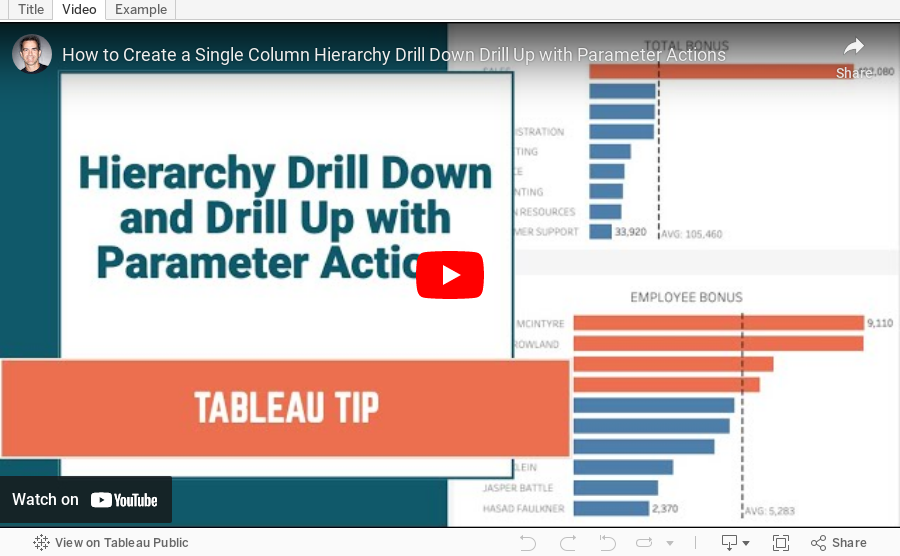
How to Create a Single Column Hierarchy Drill Down Drill Up with Parameter Actions
bar chart
,
beginner
,
boolean
,
drill down
,
drill up
,
fundamentals
,
header
,
hierarchy
,
how to
,
parameter
,
parameter action
,
set
,
set action
,
tableau
,
tip
,
trick
No comments

Twice recently I've used parameter actions to create a single column drill down and drill up to mimic a hierarchy.
Many of the examples of drill down you've probably seen so far use either set actions or parameter actions to create an additional column. The drawback is that you end up with an extra column that only has values when you drill down.
In this example, I show you how to use only ONE column to mimic drill down / drill up functionality. In total, it requires 2 parameters, 4 calculate fields, and 2 parameter actions. I find this method much more intuitive to the user.
Let me know what you think or how you put it into practice. Enjoy!
July 14, 2020
#TableauTipTuesday - How to Create a Blank Field Name
calculated field
,
empty string
,
field label
,
header
,
Tableau Tip Tuesday
,
tip
,
trick
No comments
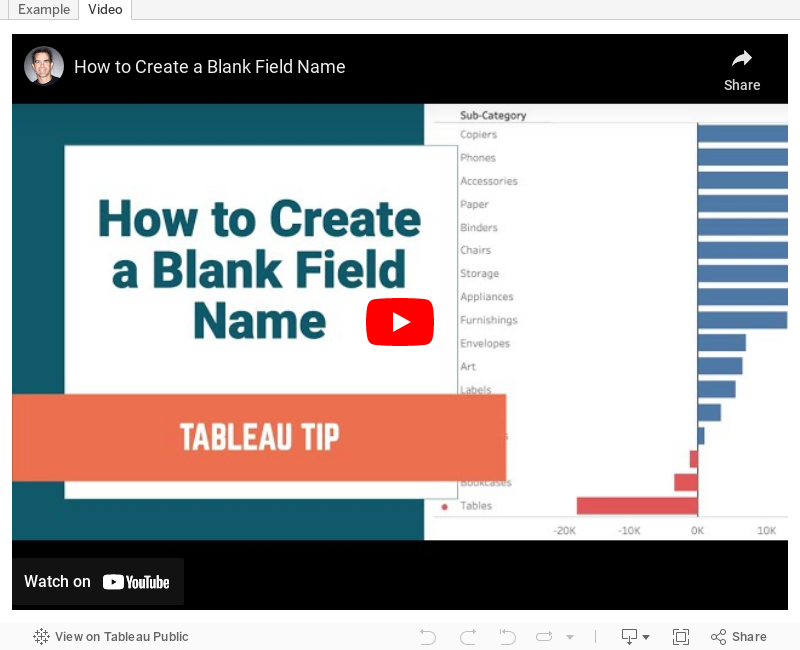
 If you try to type a space into a field name in Tableau, you will get an error message saying that it's invalid. In this video, I show you how to use special text to create a blank field name.
Thank you Ian Baldwin of The Information Lab Ireland for showing me this trick.
Subscribe to:
Posts
(
Atom
)






