February 2, 2021
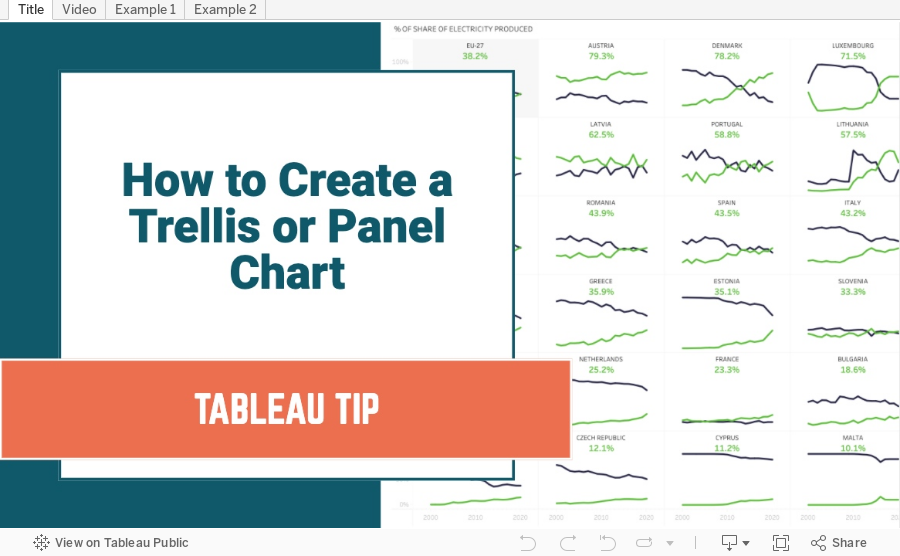
How to Create a Trellis Chart in Seven Steps
how to
,
panel chart
,
small multiples
,
table calculation
,
tableau
,
tip
,
trellis chart
,
tutorial
No comments

Trellis charts are a version of a small multiples chart that organizes the dimensions in the view across a grid. In this tip, I show you how to create a trellis chart that will work even when you are missing data.
Trellis / Panel Chart Calculations
//Columns
(index()-1)%(round(sqrt(size())))
//Rows
int( (index()-1)/(round(sqrt(size()))))
Steps
- Create the column and row calcs
- Create a custom date
- Place custom date on columns, measure on rows and dimension on detail
- Place column on columns, row on rows, and custom date on detail
- Ensure dimension is above date on detail shelf
- Change custom date on columns to ATTR
- Configure table calcs
- Check both the Dimension and the date field date in order
- Ensure the dimension is above the date field in the Specific Dimensions section
- Set "At the level" to the dimension
Follow along in this video. Enjoy!
Subscribe to:
Post Comments
(
Atom
)


No comments
Post a Comment