May 25, 2024
How to Calculate Year over Year Change in Tableau
January 31, 2023
How to Calculate Day over Day Change Excluding Weekends

In a previous tip, I showed you how to calculate day over day change and build 3 KPI cards.
However, this does not cover the case when you need to ignore weekends. In this #Tableau tip, I show you how to calculate daily change excluding the weekends.
You can copy/paste the calculations from below the video. Enjoy and good luck!

Calculations
- Latest Day
{MAX([Order Date])} - Weekday for Latest Day
DATEPART('weekday',[1. Latest Day]) - Sales for Latest Day
INT([Order Date]=[1. Latest Day])*[Sales] - Previous Day
IF [2. Weekday for Latest Day]=2
THEN [1. Latest Day]-3
ELSE [1. Latest Day]-1
END - Sales for Previous Day
INT([Order Date]=[4. Previous Day])*[Sales] - DoD Change
SUM([3. Sales for Latest Day])-SUM([5. Sales for Previous Day]) - DoD Change %
[6. DoD Change]/SUM([5. Sales for Previous Day]) - Positive Change
[7. DoD Change %]>0
August 9, 2021
#MakeoverMonday 2021 Week 32 - Mortality Rates in England and Wales

I couldn't find too much to do with this week's data set, so I ended up with some simple BANs and line charts that take the original and reorganize them a bit to make them more clear.
Resources:
- Data set - https://data.world/makeovermonday/2021w32
- Chart Guide - https://chart.guide/
- Final Viz - https://bit.ly/mm2021w32
July 21, 2021
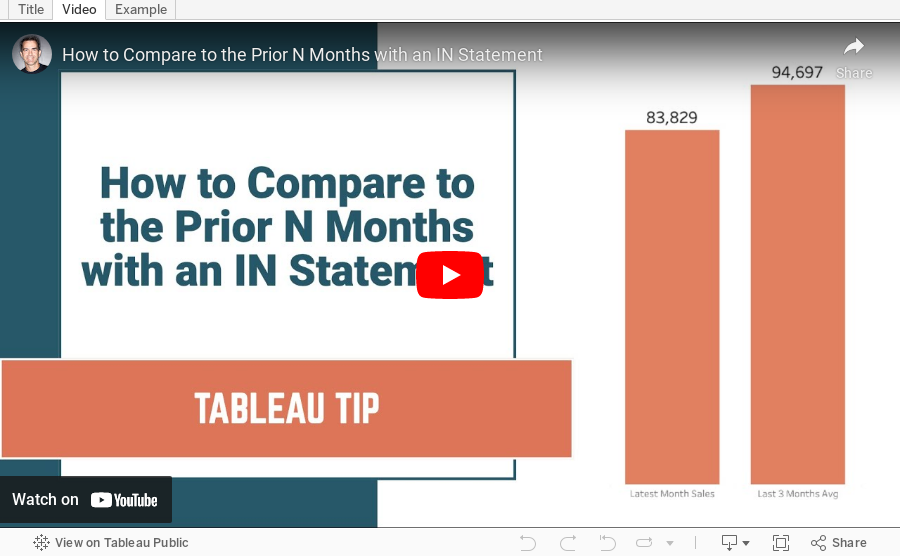
How to Compare to the Prior N Months Using the IN Function
November 24, 2020
How to Create a Combination Bar Chart & Candlestick Chart

In a recent Makeover Monday #WatchMeViz, I showed how to create a bar chart to compare two measures and then add a candlestick chart as well to show the difference between the two measures. It's actually quite simple; it requires some knowledge of:
- How Measure Names and Measure Values work together
- How to create a combined axis chart
- How to create a dual axis chart
- How to create a Gantt chart