November 4, 2022
Tableau Charts: Comparison to Budget & Prior Year
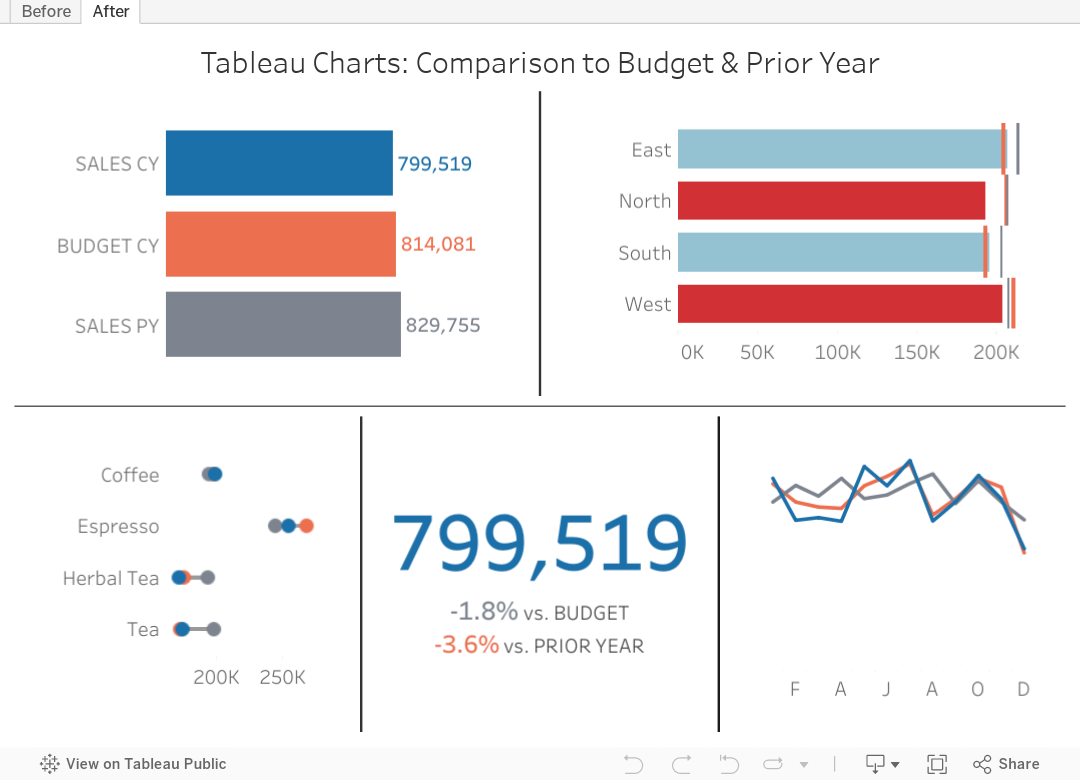
Are you looking for ways to improve how you visualize comparisons between 2 to 3 performance measurements in Tableau?
In many performance monitoring dashboards, you need to make comparison of actual values to budget or target. In this video, I will show you effective ways of making these comparisons.
I will also show you how to compare your performance to prior year (PY) to see if performance is improving year over year.
One thing you'll notice in these examples is the consistent use of color. Make sure your metrics use the same colour throughout your dashboards, reports and worksheets. The colors should be easy to differentiate.
I have 4 designs that you can apply to make any comparison look better and easier to understand.
Download the workbook for a bonus 5th chart type that compares these three metrics over time.
July 16, 2018
Makeover Monday: NBA Team Salaries Against the Cap
With that in mind, here's a second Makeover Monday from this week, a scorecard of NBA steam salaries vs. the salary cap. Click on the image below for the interactive version. From there, click or lasso any set of years and the bullet chart and BANs will update accordingly.

July 15, 2018
Makeover Monday: Historical NBA Team Salaries Against the Cap in the Salary Cap Era

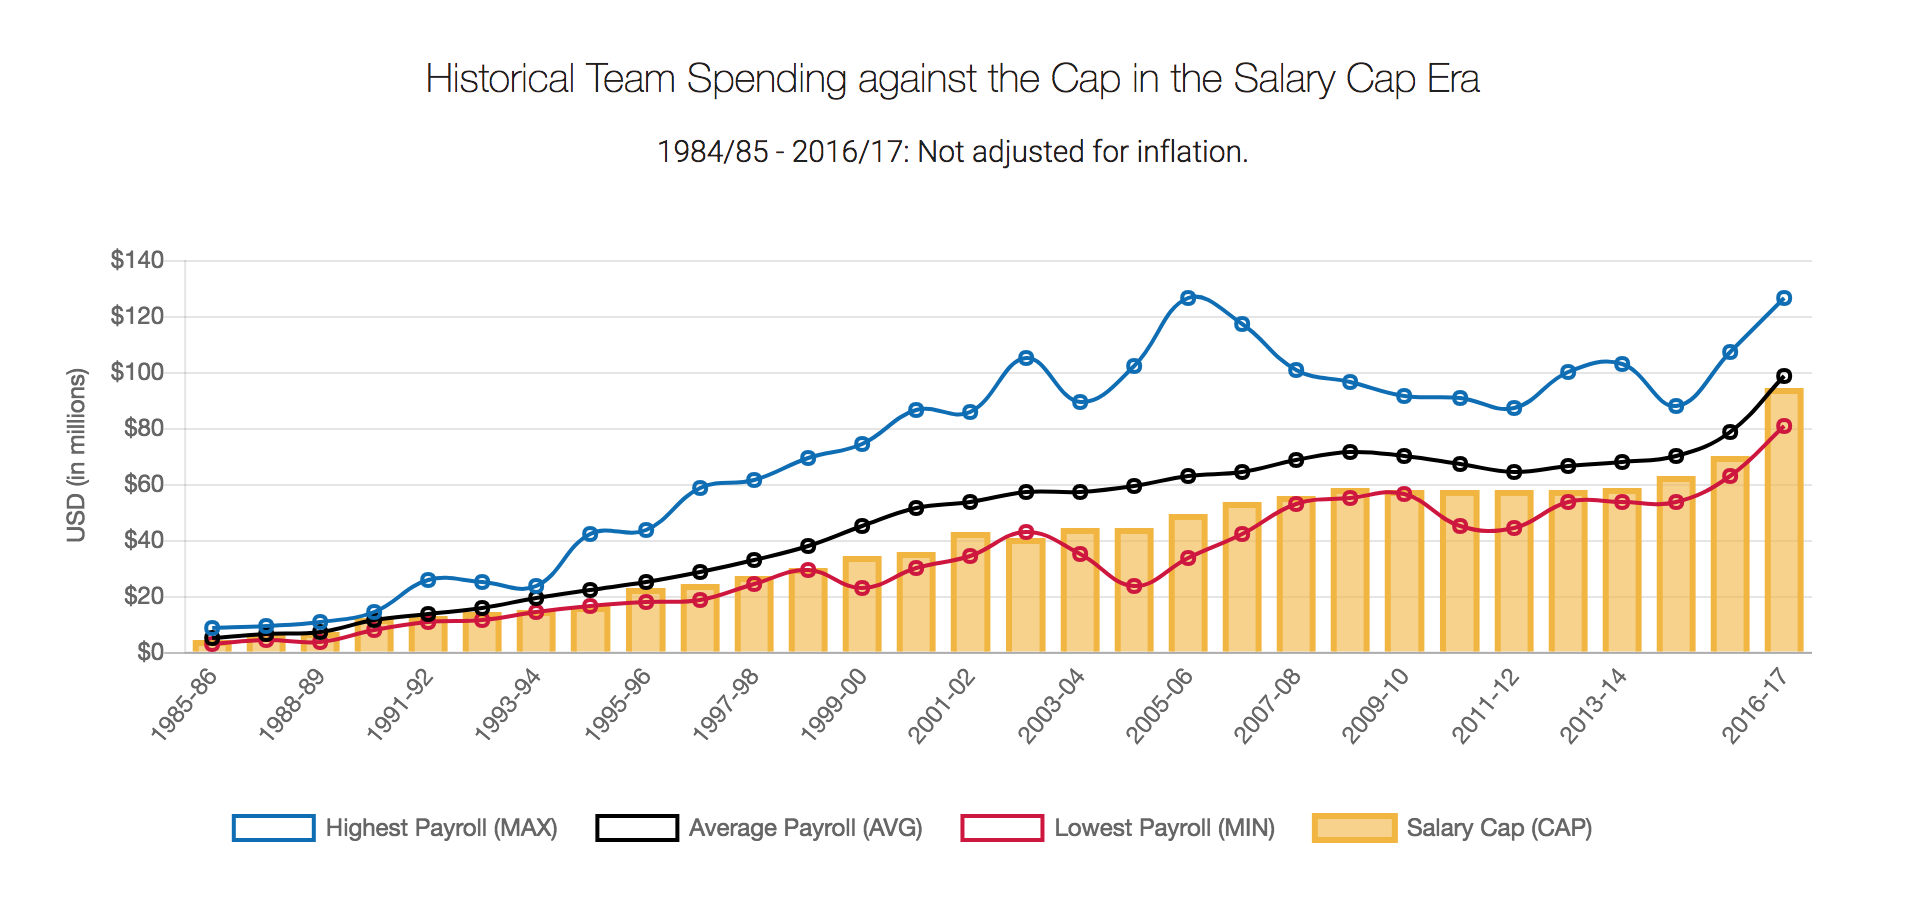
Let's start by reviewing the original viz from What's the Cap?:
What works well?
- Title and subtitle clearly explain what the chart is about
- Good labelling of the y-axis
- Using colors that are easy to distinguish from each other
- Quick interactivity on the tooltips
- Using lines for three of the metrics works well for time series data
What could be improved?
- Over other season is labeled, which isn't hard to figure out, but it looks messy
- Season labels are on a diagonal; make them horizontal
- Make the salary cap a line as well for consistency
- The legend could use some work. Why are they boxes?
- There's no option to pick a team. What if I want to know my favorite team's salary vs. the salary cap?
What I did
- I wanted to show all teams so that they could be compared. I settled on a dot plot for each season.
- I created a calculation to get the starting year for each season so that the x-axis labels would look nicer and could be displayed horizontally.
- I made the focus on the variance to the salary cap. I had no idea so many teams were over the salary cap.
- I included a line that displays the NBA average of the variance to the cap for the team selected (via a parameter).
- Since teams have moved to other cities and changed names, I created a calculation to make them franchises.

To understand how many outliers there were, I used box plots and hid the marks behind the boxes.

The problem I saw with this, though, was that I didn't feel like I had much context for the distribution of the teams, even though that it the point of a box plot. I decided to scrap the box plot and created this version in the end.

November 30, 2015
Makeover Monday: The Budget of A 25-Year-Old

Several months ago, I read this interesting article about a 25-yr old that was tracking his expenses and how he was choosing to budget his money. The author of the article chose to show the breakdown of the budget as two separate pie charts. This wasn't a surprising choice as it's the first way we learn to show parts to whole in school. The problem of choosing a pie is compounded by including a second pie for the next year, to which you are expected to make comparisons.
So, in this week's Makeover Monday, I walk through a better way to show this data. Enjoy!