Showing posts with label annotations. Show all posts
July 12, 2017
Workout Wednesday: Insights & Annotations
annotations
,
barbell chart
,
DNA chart
,
interactive
,
map
,
parameters
,
Workout Wednesday
No comments
The week 28 challenge is up on Emma's blog. Basically, you need to:

- Create a map
- Create a barbell chart
- Have the map interact with the barbell chart
- Include an option for users to add custom annotations
Be sure to check all of the requirements on Emma's blog. I immediately knew how to do all of this, so it was a matter of getting it done. The trickiest bit was the year over year change in the map. Emma and I approached the calculations required differently, as we always seem to do. She chose to use basic expressions while I used LOD expressions. Her way is definitely simpler!
Click on the image for the interactive version. Be sure to post your version to twitter and tag @EmmaWhyte and @VizWizBI so we can see your work.
April 13, 2017
Mac’s Declining Relevance To Apple | A Tableau Remake
% of total
,
annotations
,
apple
,
Business Insider
,
line chart
,
mac
,
Mike Nudelman
,
remake
,
revenue
,
share
No comments

I had a few minutes this morning so I decided to build a Tableau version. The first problem I ran into was getting the data in fiscal quarters. I couldn't find the data quickly, so I went with calendar quarter data that I found on Bare Figures. My data doesn't match the original above due to the calendaring, but that wasn't the point of the exercise. This was all about practice for me.
Essentially I wanted to replicate the viz with a more impactful title and some other minor formatting changes. Here's what I came up with. Click on the image for the interactive version.
December 21, 2015
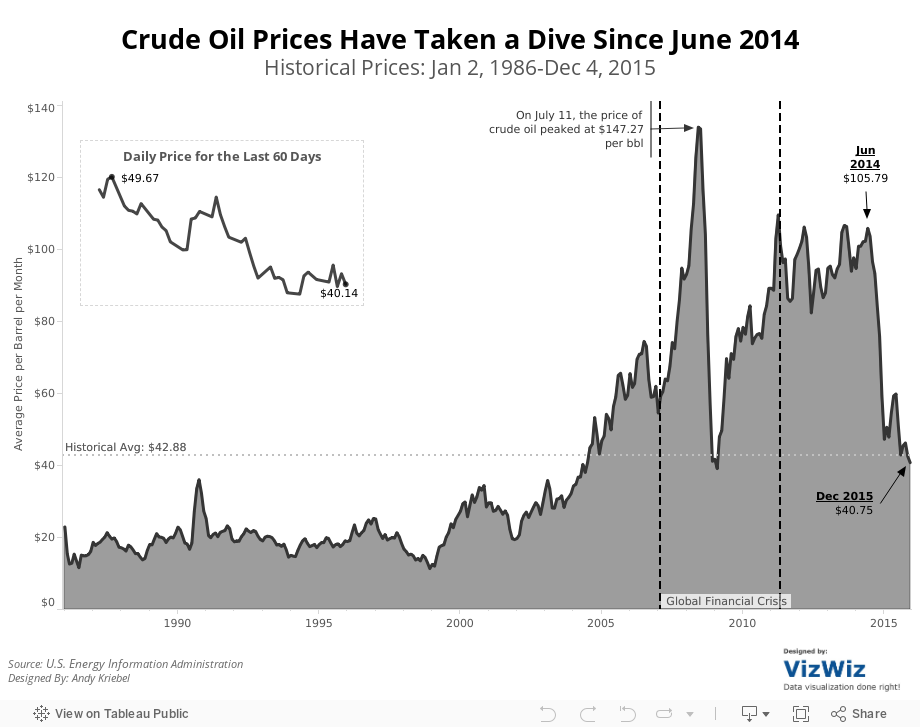
Makeover Monday: Crude Oil Prices Have Taken a Dive Since June 2014


What can be improved?
- The title doesn't tell us anything about the visualisation itself. It's important that titles engage the readers and let them know what to expect. Or the title could provide a headline for the story.
- The title says 1986-present, yet the initial visualisation shows only 2005-2015.
- The subtitle says that the viz shows "a look at previous August prices", yet every month in shown.
- There are too many lines with too many colours. Try adding all of the years back to 1986. It really gets messy then.
- It's too hard to see the overall trend from 2005-2015. The peaks and valleys are nearly impossible to see.
- The table on the bottom right is in reverse chronological order. Why? And what does the colour on the background of the table mean? It's not necessary.
So, given this list of concerns, I've created this visualisation that shows:
- The entire timeline from 1986-2015.
- I note key events that were occurring in the financial markets.
- I made the whole viz simpler and cleaner. Notice the absence of colour.
- I included the historical average for context (things aren't as bad as the original viz makes things out to be).
- I included a close-up view of the daily oil price for the latest 60 days.
Feel free to download the viz and create your own version.
November 10, 2015
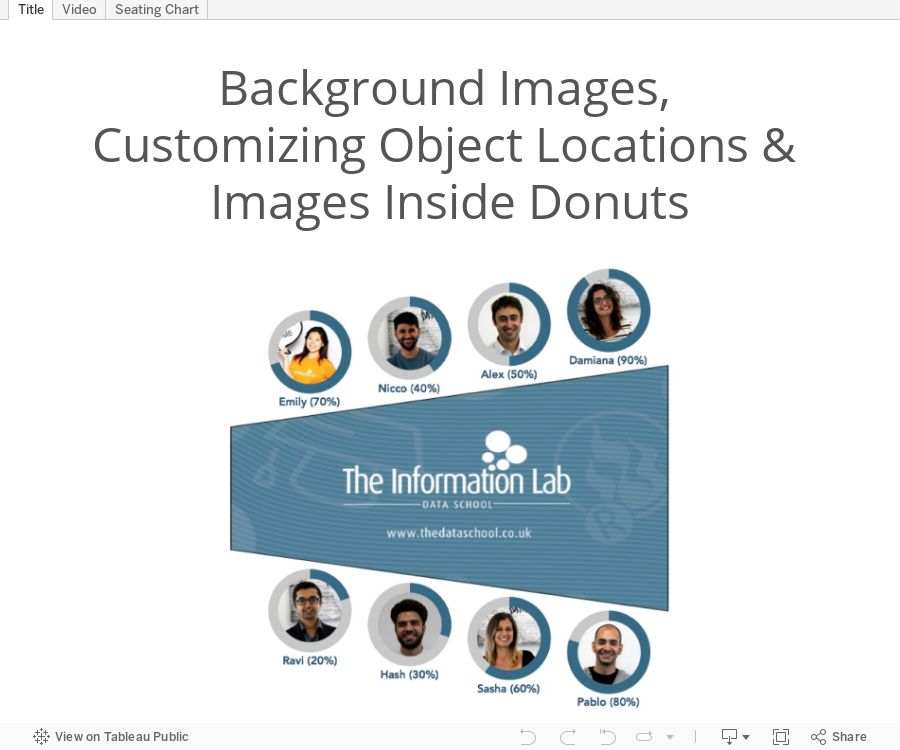
Tableau Tip Tuesday: Background Images, Customizing Object Locations & Images Inside Donuts
annotations
,
background image
,
donut chart
,
shapes
,
Tableau Tip Tuesday
,
tips
,
tricks
6 comments

The video covers:
- How to add a background image
- How to create donut charts with an image in the middle
- How to use point annotations to find the precise locations for placing objects
I hope you enjoy the tips; it was a lot of fun making this viz. Click here to see my write up for the Dear Data Two project.
Subscribe to:
Posts
(
Atom
)






