Showing posts with label apple. Show all posts
April 13, 2017
Mac’s Declining Relevance To Apple | A Tableau Remake
% of total
,
annotations
,
apple
,
Business Insider
,
line chart
,
mac
,
Mike Nudelman
,
remake
,
revenue
,
share
No comments

I had a few minutes this morning so I decided to build a Tableau version. The first problem I ran into was getting the data in fiscal quarters. I couldn't find the data quickly, so I went with calendar quarter data that I found on Bare Figures. My data doesn't match the original above due to the calendaring, but that wasn't the point of the exercise. This was all about practice for me.
Essentially I wanted to replicate the viz with a more impactful title and some other minor formatting changes. Here's what I came up with. Click on the image for the interactive version.
January 9, 2017
Makeover Monday: Have Apple Lost Their Edge With iPhone?

The iPhone…what would I do without mine? We’ve become so dependent on our mobile phones and this is primarily due to the revolution that Steve Jobs launched back in 2007. This week for Makeover Monday, we look at this chart from DazeInfo:

What works well?
- Title captures your attention
- Nice highlighting of the declining bar in 2016
- Simple colors that work well
- Pretty simple, easy to understand viz
What could be improved?
- Beveled bars are unnecessary; just make them flat
- What does the * mean next to 2016?
- Is the axis needed if the bars are labeled?
- Inconsistent label formatting; make them all the same number of decimals
- Remove the gridlines
For my version, I wanted to focus on the story that was in the article itself. I was particularly struck by the percentage of revenue that the iPhone now accounts for in Apple’s overall revenue.
January 21, 2016
Dear Data Two | Week 41: Music
apple
,
bar chart
,
circles
,
Dear Data Two
,
itunes
,
music
,
pie chart
,
shapes
,
spiral
1 comment

This time, I started my analysis in Vizable and after a few minutes I had a good feeling for the overall patterns in the data.
Having fun today using @VizableApp to understand my music data for #DearDataTwo Week 41 w/ @HighVizAbility pic.twitter.com/z23jE9Mcxl
— Andy Kriebel (@VizWizBI) January 21, 2016
Using Vizable this way definitely helped speed up my analysis in Tableau. I like how Vizable keeps me from overthinking the analysis. It encourages me to play rather than overdiagnose. That being what it is, I was quite surprised to learn how much alternative music I listen to. I suppose that goes back to when I was in college and that genre first became more popular.
I also had a playlist of the songs that are in my primary running playlist, so I used that throughout the analysis as well to help me see if what I listened to in general was the same music I listen to when I run.
For the final visualisation, I accidently created this radial pie chart thingy. I would never create something like this if it weren't for this project. I consider this more "data art" than data visualisation.

Click through the story below to see how I conducted my analysis and to see the postcard I created.

June 1, 2015
Makeover Monday: China Is Poised to Surpass the Americas as Apple's Largest Market
apple
,
Chart of the Day
,
emphasis
,
line chart
,
Makeover Monday
,
revenue
,
stacked bar chart
,
storytelling with data
No comments

I am not a very big fan of stacked bar charts, particularly those that try to represent change over time, like this week’s makeover candidate from Chart of the Day.

The article is trying to emphasize the change in the share of Apple revenue in China compared to the Americas. Here are some problems I have with this chart:
For the makeover, I’m going back to some of the things I learned in Cole Nussbuamer’s fantastic course about emphasising the data that you want people to pay attention to.
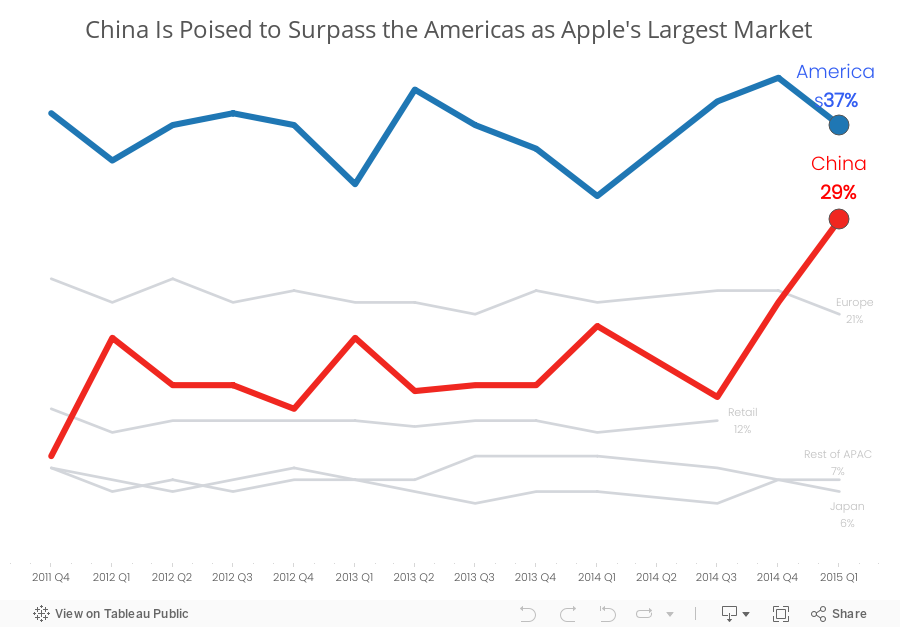
Here’s what I’ve done differently:
Which version do you prefer? What would you do differently? There are so many ways to redesign charts and no single way is 100% correct.
- It’s very hard to compare stacks in a bar chart over time because each stack is influenced by those stacks below it.
- The title of the article and the chart don’t match. The article says China vs. the US, but the chart is China vs. the Americas.
- There is not enough emphasis on the comparison. The rest of the regions should fall to the background.
- I don’t like the legend above the chart in this case because I’m constantly having to go back and forth.
For the makeover, I’m going back to some of the things I learned in Cole Nussbuamer’s fantastic course about emphasising the data that you want people to pay attention to.
Here’s what I’ve done differently:
- I changed the title to reflect the purpose of the story.
- I changed the chart to a line chart to make it easier to see the trends for each region.
- I’m only emphasising the Americas and China. The rest of the regions are in a light grey.
- I’ve added annotations to make it easier for the reader to see the values.
- I removed the color legend as it’s not necessary since I’ve labeled the end of each line.
Which version do you prefer? What would you do differently? There are so many ways to redesign charts and no single way is 100% correct.
February 3, 2011
Who will be the all-time Super Bowl ad Champ?
apple
,
coca-cola
,
coke
,
commercial
,
football
,
super bowl
No comments
Vote here (and vote for Coke!): http://bit.ly/f24E61

Subscribe to:
Posts
(
Atom
)






