Showing posts with label spiral. Show all posts
September 26, 2022
#MakeoverMonday Week 39 - Average Internet Speeds Across Europe
data prep
,
europe
,
internet
,
LOD
,
Makeover Monday
,
small multiples
,
spiral
,
starburst
,
sunburst
,
table calc
,
trellis chart
,
union
No comments

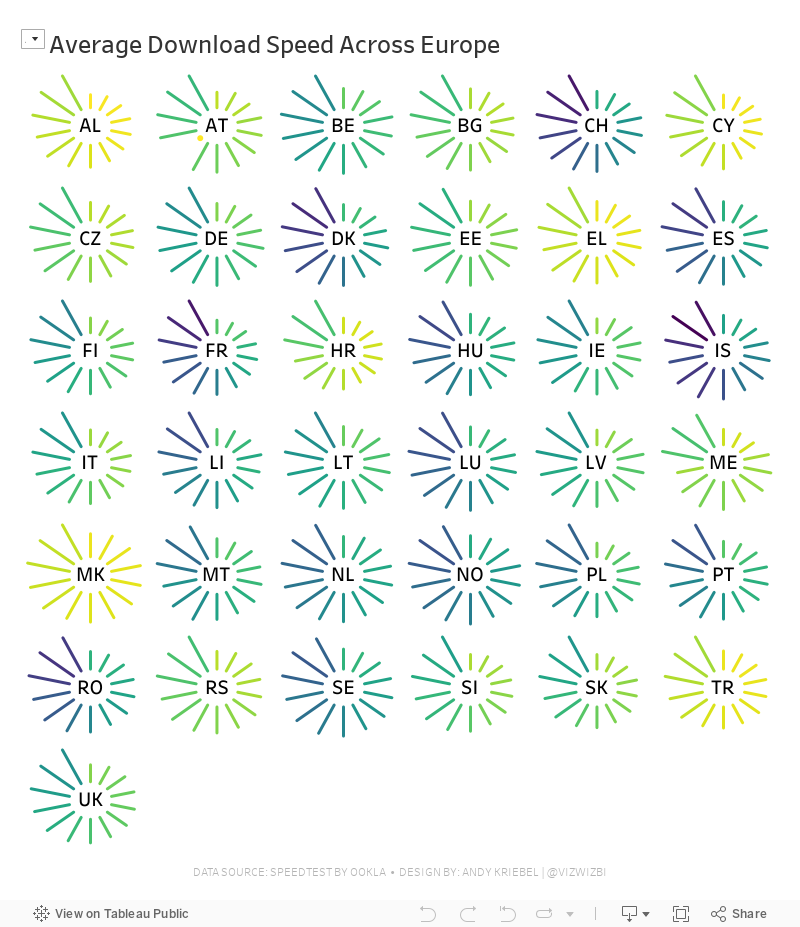
My goal this week was to correct my failures from last week, so I focused almost exclusively on building the starburst/sunburst chart. As promised to the viewers, I will also record a separate tip video for how to build them.
Here's the WatchMeViz and the viz is below that.
January 21, 2016
Dear Data Two | Week 41: Music
apple
,
bar chart
,
circles
,
Dear Data Two
,
itunes
,
music
,
pie chart
,
shapes
,
spiral
1 comment

This time, I started my analysis in Vizable and after a few minutes I had a good feeling for the overall patterns in the data.
Having fun today using @VizableApp to understand my music data for #DearDataTwo Week 41 w/ @HighVizAbility pic.twitter.com/z23jE9Mcxl
— Andy Kriebel (@VizWizBI) January 21, 2016
Using Vizable this way definitely helped speed up my analysis in Tableau. I like how Vizable keeps me from overthinking the analysis. It encourages me to play rather than overdiagnose. That being what it is, I was quite surprised to learn how much alternative music I listen to. I suppose that goes back to when I was in college and that genre first became more popular.
I also had a playlist of the songs that are in my primary running playlist, so I used that throughout the analysis as well to help me see if what I listened to in general was the same music I listen to when I run.
For the final visualisation, I accidently created this radial pie chart thingy. I would never create something like this if it weren't for this project. I consider this more "data art" than data visualisation.

Click through the story below to see how I conducted my analysis and to see the postcard I created.

March 5, 2013
Spirals vs. bars – Why does Nielsen makes things so hard for us?
I’m not exactly sure what to call this type of chart from Nielsen, so I’m going to stick with calling it a spiral chart. It’s just plain awful.

I understand the ranking, only because of the numbers, not the chart. I’m guessing the colors are used so that you can follow them around the race track. Wouldn’t a simple bar chart be so much better?

November 2, 2009
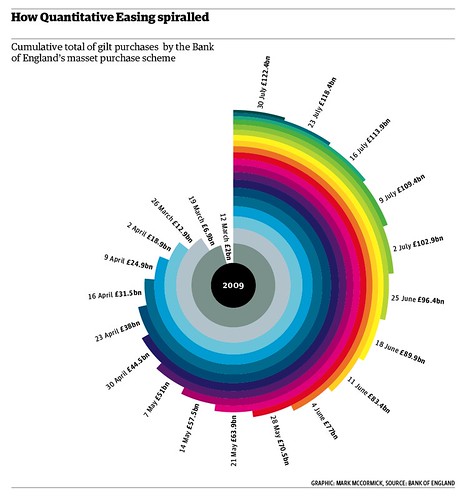
I'm Dizzy
If this doesn't make you cringe or make your eyeballs spin, I'm not sure what will. On top of that, I have no idea what it's trying to tell me.

Subscribe to:
Posts
(
Atom
)






