November 14, 2016
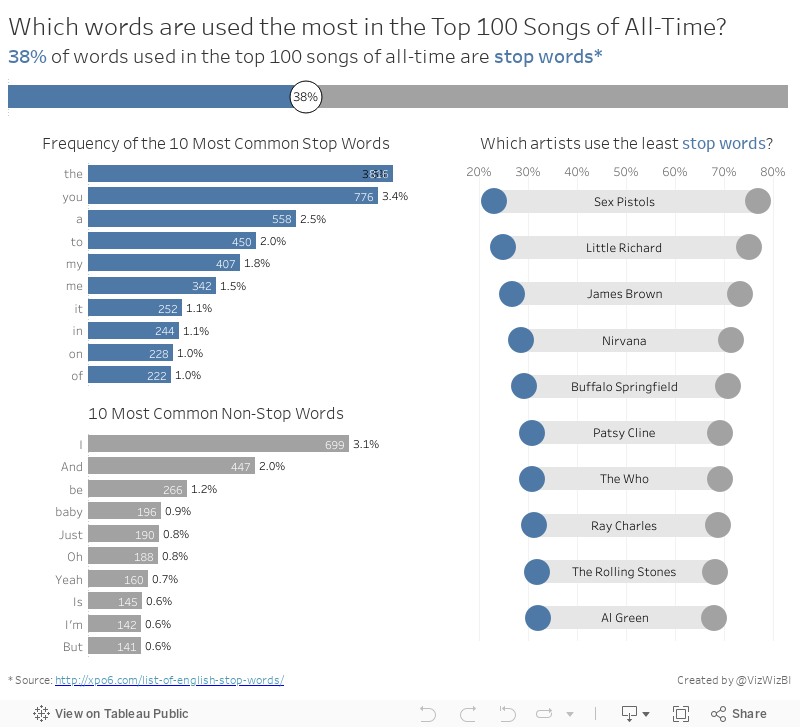
Makeover Monday: The Words of the Top 100 Songs of All-Time


What works well?
- Simple title
- Good references
- Treemaps are generally a poor choice for showing the distribution of the words
- Way too many colors
- It's impossible to make any sense of the words and see any patterns
January 21, 2016
Dear Data Two | Week 41: Music

This time, I started my analysis in Vizable and after a few minutes I had a good feeling for the overall patterns in the data.
Having fun today using @VizableApp to understand my music data for #DearDataTwo Week 41 w/ @HighVizAbility pic.twitter.com/z23jE9Mcxl
— Andy Kriebel (@VizWizBI) January 21, 2016
Using Vizable this way definitely helped speed up my analysis in Tableau. I like how Vizable keeps me from overthinking the analysis. It encourages me to play rather than overdiagnose. That being what it is, I was quite surprised to learn how much alternative music I listen to. I suppose that goes back to when I was in college and that genre first became more popular.
I also had a playlist of the songs that are in my primary running playlist, so I used that throughout the analysis as well to help me see if what I listened to in general was the same music I listen to when I run.
For the final visualisation, I accidently created this radial pie chart thingy. I would never create something like this if it weren't for this project. I consider this more "data art" than data visualisation.

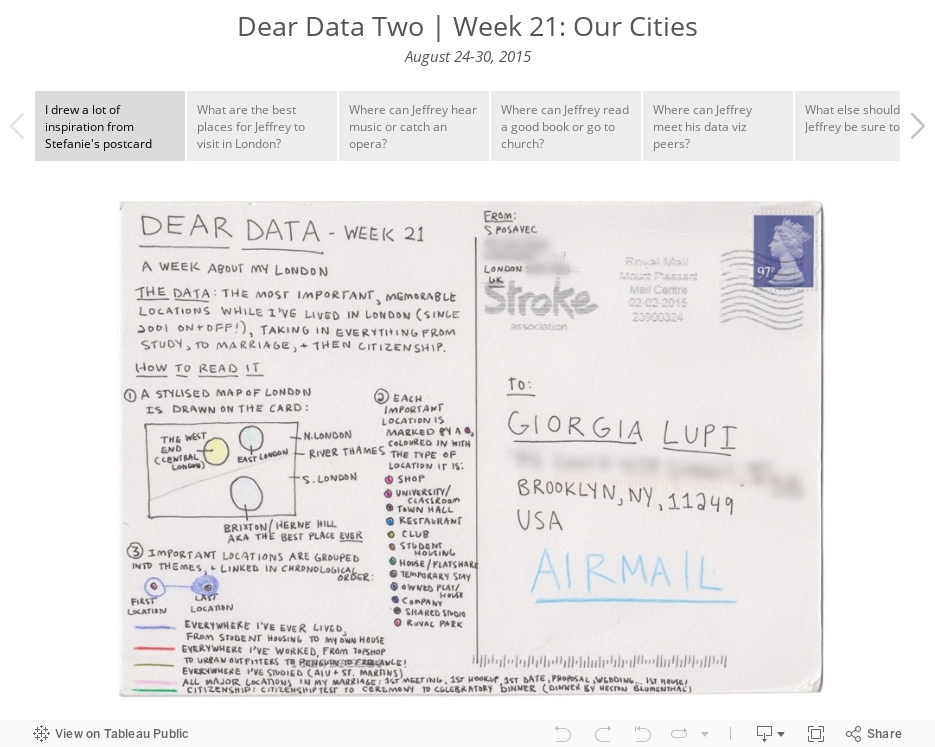
Click through the story below to see how I conducted my analysis and to see the postcard I created.

September 3, 2015
Dear Data Two | Week 21: Our Cities

January 6, 2012
Information is Beautiful? Only if you like a totally useless mess of nothingness
I have a problem with David McCandless of Information is Beautiful. From his own website he says:
A passion of mine is visualizing information – facts, data, ideas, subjects, issues, statistics, questions – all with the minimum of words.
I’m interested in how designed information can help us understand the world, cut through BS and reveal the hidden connections, patterns and stories underneath. Or, failing that, it can just look cool!
So let’s look at a couple of these statements in the context of his latest infographic.

Has David met any of his own criteria? Let’s check.
- Minimum of words – No! All this infographic contains is words…horrible!
- Facts – Maybe. If you consider a bunch of words facts, then I guess he meets this criteria.
- Data – No, not even close
- Ideas – No, nothing that I can see
- Can help us understand – No, not for me
- Reveal the hidden connections, patterns and stories – No, absolutely not!
- It can just look cool – Seriously?
To summarize, this is one of the worst infographics I’ve EVER seen. Shouldn’t we expect better from an “expert”? It’s impossible to gleam even the slightest bit of insight or data outside two things: nationality and that the album falls somewhere in the top 21.
How am I supposed to deduce the rank? The size? The width? The font? The location? I have no idea and no one else will likely know either. Throw me a bone and at least give me some type of instructions for making sense of this mess.
And another thing. Why the top 21? At first, I thought the list only went to 21, but Metacritic.com lists the top 30. And four albums are tied for 20th. The top 21 makes no sense whatsoever! Maybe David likes blackjack?
Let’s consider the definition of an infographic from Wikipedia (not the defining source, I know). I’ve bolded what I consider the key points.
Information graphics or infographics are graphic visual representations of information, data or knowledge. These graphics present complex information quickly and clearly.
Did David meet any of these criteria?
- Graphic visual representation – No, he merely created a wordle.
- Present complex information quickly and clearly – No. I can’t garner any insights quickly and clearly. Can you?
Ok, you can tell that I think his work is a totally useless mess. But how would I present the data to allow for quick and clear insights? I’d use Tableau.
My viz may not be an “infographic” in its purest sense since it doesn’t have all of the cute pictures, figurines, and unnecessary clutter, but I have met David’s criteria, the criteria for an infographic, plus much more.
- Graphic visual representation – Check
- Present complex information quickly and clearly – Check
- Minimum of words – Check
- Facts – Check
- Data – Check
- Ideas – Check
- Can help us understand – Check
- Reveal the hidden connections, patterns and stories – Check
- It can just look cool – Check
But Tableau let’s you go above and beyond.
- Interact with the filters and highlighting
- Change the Points Type
- Filter and/or highlight nationalities
- The data is ALWAYS ranked based on the selections you make
I’m sick and tired and tired and sick of seeing useless infographics like this one. I won’t keep my finger crossed that they’re going away anytime soon though.






