November 2, 2015
Makeover Monday: The History of Scoring and Length of Games in Major League Baseball
Alberto Cairo
,
baseball
,
Chart of the Day
,
connected scatterplot
,
Cork Gaines
,
sports chart of the day
,
time series
No comments

Today marks the end of my two week hiatus from makeovers. #Data15 was absolutely amazing and then I had a great family holiday in Copenhagen to help me detox from Vegas.
This week, I’m taking a look at this chart from Sports Chart of the Day. In the article, Cork Gaines states:
I’d love your feedback on my approach to the makeover using story points and also how I constructed the connected scatterplot. Does it do a better job of telling the story?
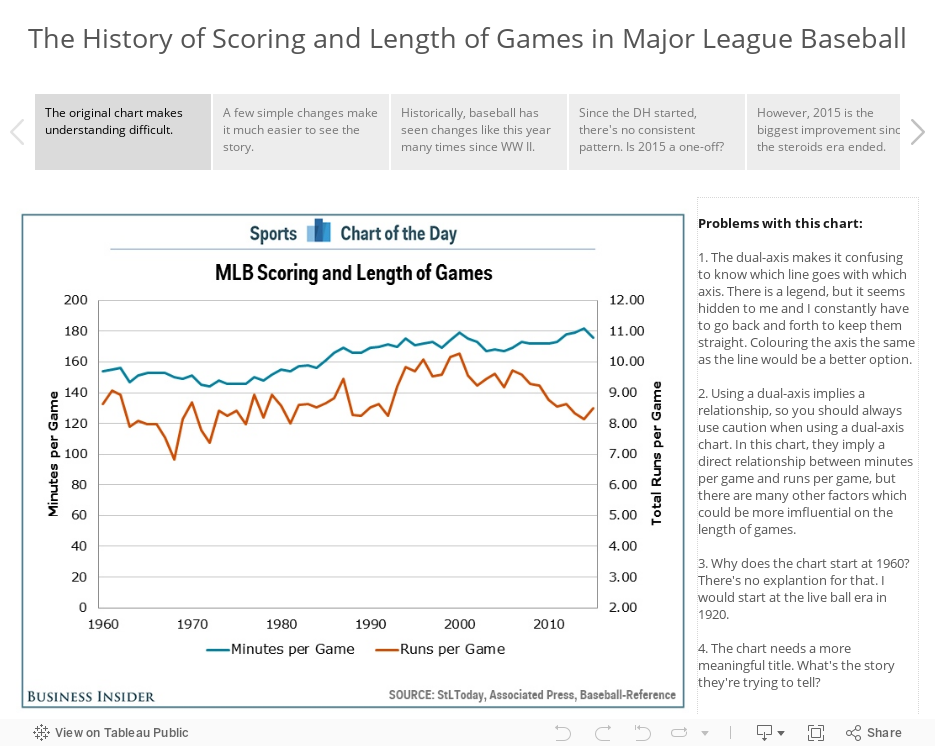
This week, I’m taking a look at this chart from Sports Chart of the Day. In the article, Cork Gaines states:
"It is just one season, but the first year under commissioner Rob Manfred would have to be considered a resounding success as two of the league's most troubling trends are now once again moving in a better direction."This is great, but the accompanying chart implies that a one year change makes a trend. For the makeover, I’m using story points to:
- Show what’s wrong with the chart
- Show a better version of the same chart
- Show an alternative view that debunks Cork’s implication
- Use a connected scatterplot in the vain of those praised by Alberto Cairo to tell the story of runs per game versus length of game from 1920 to 2015.
I’d love your feedback on my approach to the makeover using story points and also how I constructed the connected scatterplot. Does it do a better job of telling the story?
Subscribe to:
Post Comments
(
Atom
)


No comments
Post a Comment