November 3, 2015
Tableau Tip Tuesday: How to Create Multi-row DNA Charts

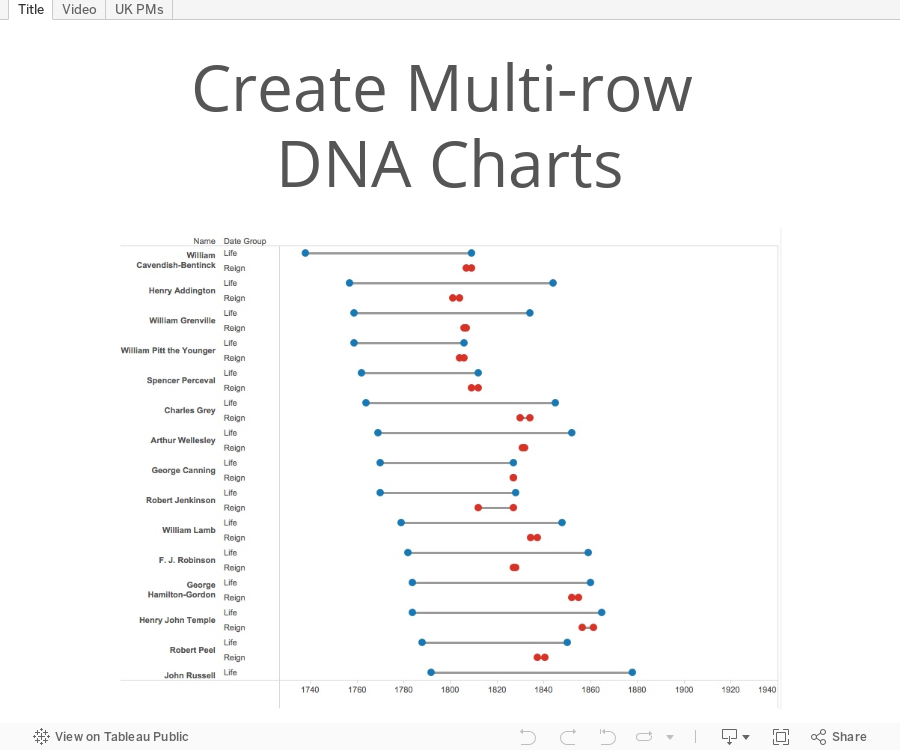
Several weeks ago, Alex Gimson of Import.io reached out to me asking how to create multi-row DNA charts. Ultimately, he wanted two rows for each UK Prime Minister: one to represent the length of their life and a second row to represent the length of their term as PM.
This was pretty straightforward, but required using the pivoting capabilities in the connection window.
This was pretty straightforward, but required using the pivoting capabilities in the connection window.
Subscribe to:
Post Comments
(
Atom
)


No comments
Post a Comment