August 9, 2017
Workout Wednesday: Continuous Dates are Tricky

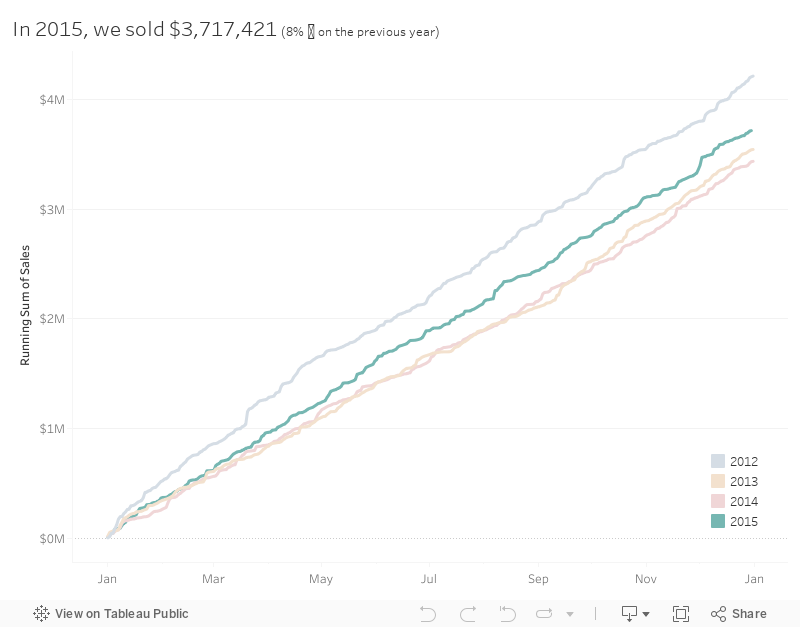
Her requirements are pretty straightforward. I was able to get everything quickly with the exception of the month labels on the x-axis.
FIRST ATTEMPT
To do the line chart, I created a Day of Year calc and plotted that on the x-axis. Notice this results in the day number on the scale.
SECOND ATTEMPT
To format the scale, I first changed the number format to mmm to give me month abbreviations. That gets me close, but some months are missing and the months are labeled at the middle of the month whereas Emma's are labeled at the start of the month.
THIRD ATTEMPT
I sent Emma a message with a few questions, basically because I was stuck. All she said was:You'll have to re-think the date you have on the x-axis so you can also colour by year.
What does that even mean? I'm beginning to get a sense for the sort of torture I put people through. Ok, so I somehow need to get my x-axis to act like a date, yet still be able to show every day for each year in the view. I also need it to only be month and day. Hmmm: Hey Google, can you help?
Yes indeed! I searched for "tableau month and day of year" and the second search result took me to the Forums which had exactly the question I was asking. The brilliant Jonathan Drummey came up with this formula:
DATE(DATEADD('day',DATEPART('day',[Date]),DATEADD('month',DATEPART('month',[Date])-1,#1903-12-31#)))
Sweet! All I needed to do was swap out [Date] for [Order Date] and I was good to go. Now I have the exact result I needed.
Awesome challenge! I love learning something new! Here's my final product.
February 22, 2017
Workout Wednesday: Merimekko Makeover
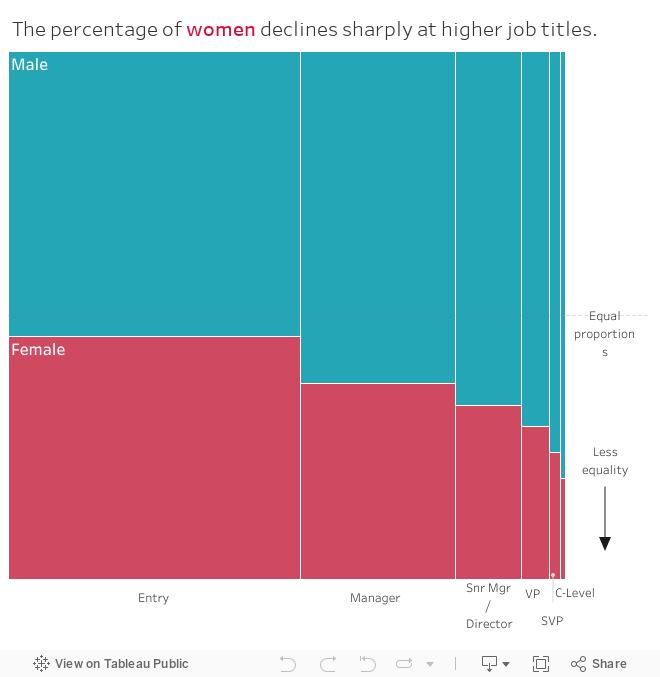
I read through Jonathan's post once and tried to create the Merimekko on my own, but that didn't work out so well. Apparently I was 99% of the way there, however, the order that I placed my dimensions in the view is what tripped me up. I decided to follow Jonathan's blog step-by-step and built a table first like he did to verify the calculations before changing the table into a chart.
This is a good practice in general when working with calculations, especially table calcs and LOD calcs. Build a table to verify the calculations are working as expected, then create your chart. It's much easier to identify problems.
Emma's rules were pretty straight forward:
- Show the 50% point of equality as a grid line
- Set the dashboard size to 660 * 650 pixels
- Add on the direction of less equality
- Label the columns of the Marimekko to match hers
- Label the first two segments Male and Female
- Make sure the tooltips match hers
July 26, 2012
Tableau Tip: Adding totals of a 2nd measure on top of stacked bar charts
Before I get started, credit for the technique/trick in this blog post to Jonathan Drummey. Follow Jonathan on Twitter or follow his new blog.
Also, if you don’t use the Tableau Forums for getting answers to those things that have you stumped, then you’re missing out. It’s very rare that I can’t either (1) find the answer or (2) get the answer by starting a discussion.
Now, consider that you have a stacked bar chart of sales by Product Container color-coded by Region.

Great! But it would be more useful to label the top of each bar with the totals sales like this.

Awesome! I was banging my head trying to figure out how to make this work. Adding totals to a stacked bar is straight forward, but the trick here is that the bars represent % of total, not the raw sales.
It seems so simple, but I was stumped. Fortunately Jonathan was there to save the day, and I can’t believe how simple it was.
Here’s how it’s done, starting with the stacked bar.
Step 1 – Create a calculated field with the value of one

Step 2 – Drag your new “One” measure onto the right side of the chart until you see the dotted lines (which indicate a dual axis), then drop it.
You now probably have an ugly chart like this:

Step 3 – Change the aggregation for the One measure from Sum to Average (right-click on the One pill, go down to Measure, then pick Average)
Step 4 – Right-click on the right axis and choose Synchronize Axis
Step 5 – Click on the carrot on the top-right of the Marks card and choose Multiple Mark Types
Step 6 – Scroll to the right on the Marks card until you get to SUM(Sales). Change the mark type to Bar.

Step 7 – Scroll to the right again to get to AVG(One).
- Remove Region from the Color shelf
- Set the color transparency to 0%
- Change the mark type to Gantt Bar (Joe Mako suggested using Gantt Bar instead of Bar because it creates a line at the top and it will eliminate the chance that the user could select a hidden bar.)
- Drag the Sales measure onto the Label shelf
- Set the Label alignment to Top

You should now have a chart that looks like this:

Step 8 – Right-click on the right axis and uncheck Show Header
That’s it! Pretty simple! (Now that I know how to do it.)

Download the workbook here.






