Showing posts with label negative. Show all posts
April 5, 2022
How to Always Sort a Dimension to the Bottom of a Chart
ascending
,
bar chart
,
calculated field
,
chart
,
comparison
,
context
,
descending
,
dimension
,
graph
,
group
,
highlight
,
how to
,
negative
,
sort
,
sorting
,
tableau
,
tip
,
tutorial
No comments
September 22, 2020
#TableauTipTuesday: How to Visualize Survey Data on a Likert Scale and Include a Net Promoter Score
diverging bar chart
,
Likert
,
negative
,
neutral
,
positive
,
responses
,
scale
,
survey
,
survey results
,
surveymonkey
,
tableau
,
Tableau Tip Tuesday
,
tip
,
visualization
No comments

We've all answered Likert scale questions. These are questions like "How likely are you to recommend our product?" and they are typically on a five point scale (e.g., from not at all to very highly likely).
In this video, I show you how to visualize Likert scale data and how to include a Net Promoter Score (NPS). To get the data that I used, simply download the workbook and unzip it. You will then see a folder named "Data".
Useful links:
1. What is a Likert Scale? http://bit.ly/LikertSurveyMonkey
2. What is a Net Promoter Score? https://www.netpromoter.com/know/

January 3, 2016
Dear Data Two | Week 38: Negative Thoughts
circles
,
Dear Data Two
,
family
,
locations
,
negative
,
stacks
,
stress
,
thinking
,
thoughts
3 comments

I tracked the date, what was on my mind, the general topic, where I was, who I was with, the stress level and what I was doing.
I tend to always look at what Giorgia and Stefanie produce each week as a way of looking for inspiration. This week, I really liked how Stefanie created piles for her negative thoughts.

Stefanie included a classification of inward/outward for each negative thought then split them up so you could see how much more there was on one side vs. the other. So I went back to my data and added a similar classification. More on this in a minute.
Here are some of the highlights from the data analysis I performed on my data:
- My inward negative thoughts more than doubled my outward negative thoughts. This means that I was keeping my negativity to myself more than expressing it to others. For me, this is good because I have always tended to just say whatever is on my mind. Does this mean I am learning to control myself a bit more?
- Most of the negative thoughts were me by myself. Otherwise, Beth was second most involved. This really isn't surprising given it was Christmas week, we went shopping together, and every year I get stressed about how much we spend on Christmas.
- 75% of my negative thoughts were low stress...phew!!
So back to the postcard. I thought Stefanie missed an opportunity to think about the "weight" of her negative thoughts. How could I represent my data on what looked like a scale? How could I incorporate more of the metadata? I came up with this Tableau viz:

What I tried to do was make the inward negative thoughts appear "heavier" than the outward negative thoughts by adjusting the y-axis. I was also able to include who I was with (inner circle) and the topic (outer circle).
For my postcard, I was able to make it look even more like a scale and I also was able to include where I was. This turned out to be a good example of how you can do way more by hand than you can with any software.
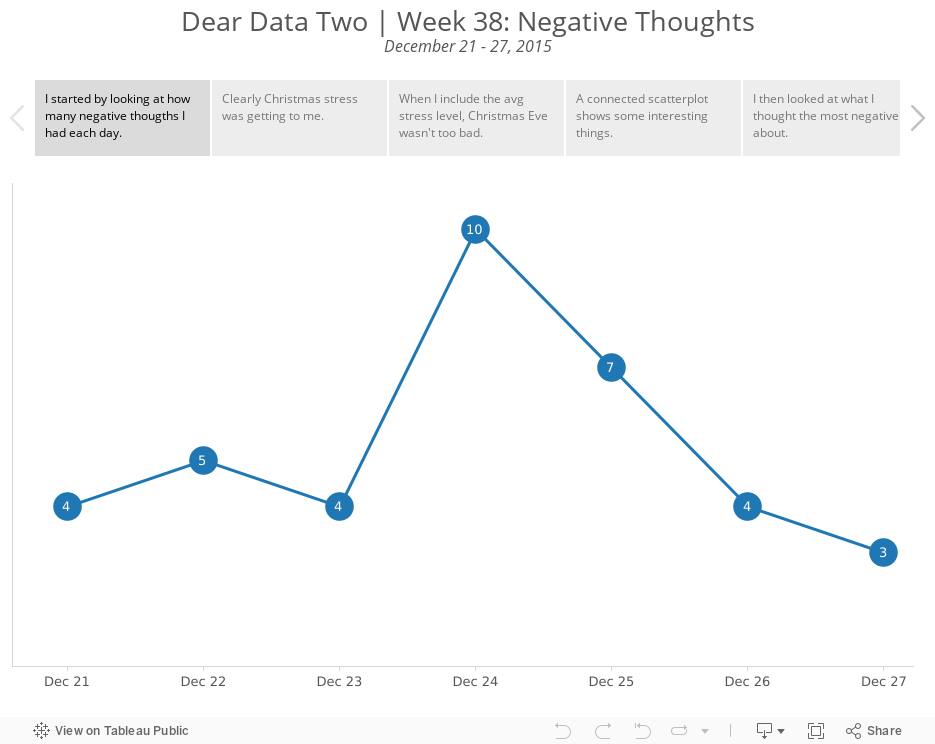
Explore the entire week in the Tableau story below, including my thought process for how I decided which data to put in the final viz.
Subscribe to:
Posts
(
Atom
)



