July 4, 2016
Makeover Monday: Where Are the Best & Worst States to Raise a Child in America?

This week the UK Zens are on Tour and we’re taking Makeover Monday on the road with us. And it’s Independence Day in America so I chose a visualisation about raising children in America. Happy birthday ‘Merica!


What works well?
- Nice big titles make it easy to know what the map is about
- The colors make is easy to see the good and bad concentrations.
- Alaska and Hawaii are neatly brought in under the continental U.S.
What doesn’t work?
- The ranges for the colors are equivalent.
- Using a filled map could lead to visually distortion; poor Rhode Island!
- The separate maps that you have to page through make comparisons too difficult.
- There’s no way to see a State’s ranking in all categories at once.
I iterated through lots of ideas this week and found two that I think work well.
- I changed the filled map to a hex map then put all of the maps side by side.
- I created heat maps and bump charts that show the individual State rankings in each category.
- I added bar charts in the tooltips.
- I included highlighting interactivity.
Both views are shown below. Which one do you prefer?
January 3, 2016
Dear Data Two | Week 38: Negative Thoughts

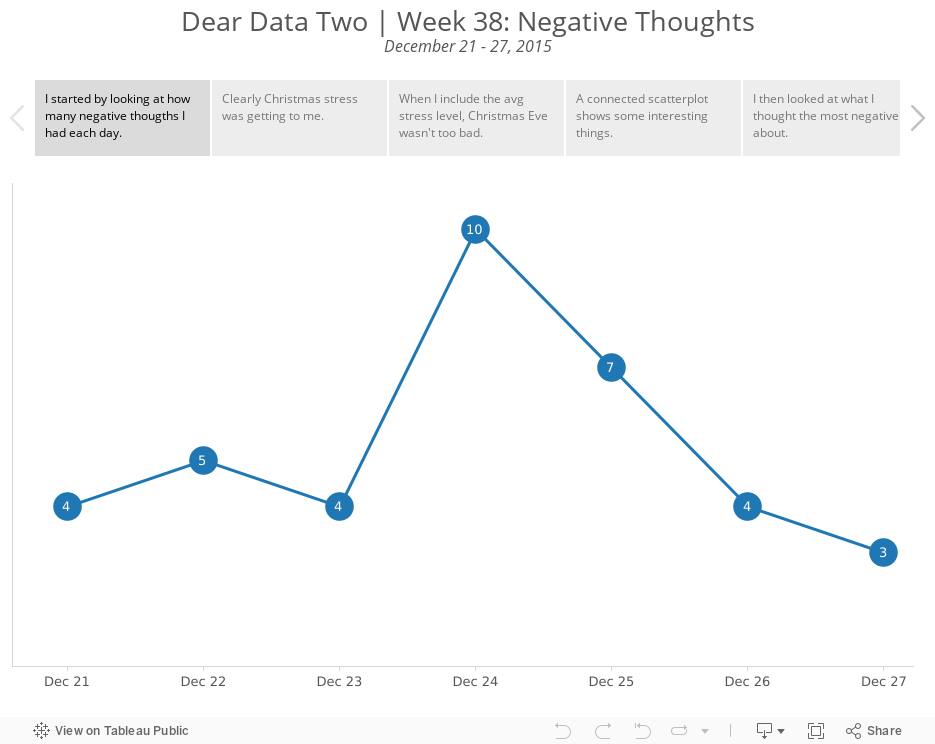
I tracked the date, what was on my mind, the general topic, where I was, who I was with, the stress level and what I was doing.
I tend to always look at what Giorgia and Stefanie produce each week as a way of looking for inspiration. This week, I really liked how Stefanie created piles for her negative thoughts.

Stefanie included a classification of inward/outward for each negative thought then split them up so you could see how much more there was on one side vs. the other. So I went back to my data and added a similar classification. More on this in a minute.
Here are some of the highlights from the data analysis I performed on my data:
- My inward negative thoughts more than doubled my outward negative thoughts. This means that I was keeping my negativity to myself more than expressing it to others. For me, this is good because I have always tended to just say whatever is on my mind. Does this mean I am learning to control myself a bit more?
- Most of the negative thoughts were me by myself. Otherwise, Beth was second most involved. This really isn't surprising given it was Christmas week, we went shopping together, and every year I get stressed about how much we spend on Christmas.
- 75% of my negative thoughts were low stress...phew!!
So back to the postcard. I thought Stefanie missed an opportunity to think about the "weight" of her negative thoughts. How could I represent my data on what looked like a scale? How could I incorporate more of the metadata? I came up with this Tableau viz:

Explore the entire week in the Tableau story below, including my thought process for how I decided which data to put in the final viz.
December 12, 2015
Dear Data Two | Week 31: Positive Feelings

I recently had a conversation with Paul Banoub and he was telling me about the impact that the Dear Data Two presentation in Vegas had on him, particularly when I talked about being nicer to people (specifically my family). This really struck me and it made me realise that I have a great opportunity through this project to really learn about myself.
So when I looked back at tracking positive feelings, I assumed that all would be rosy and great. I mean, I have a great life, a great job, a great family, live in an amazing place. Yet little did I know that I was in for a shock!
For week 31, I tracked the time, place, who I was with, and what I was doing each time I felt a positive emotion. I started by exploring the data in Tableau, which I walk you through in the story points below. The shock came when I started looking at the people I was having positive feelings with, or I should say, the people I WASN’T having positive feelings with, notably my three youngest kids. I had no idea that I felt this way until I actually looked at the data, and this is the power that this little project has brought into my life. It has helped me recognize areas where I can improve. For that, I’ll be forever grateful.
If I listen to the data, I can make a real, significant difference on my life, how I perceive people, how I treat people, and how and who I spend my time with.
August 7, 2015
Dear Data Two | Week 12: The Kriebel Family

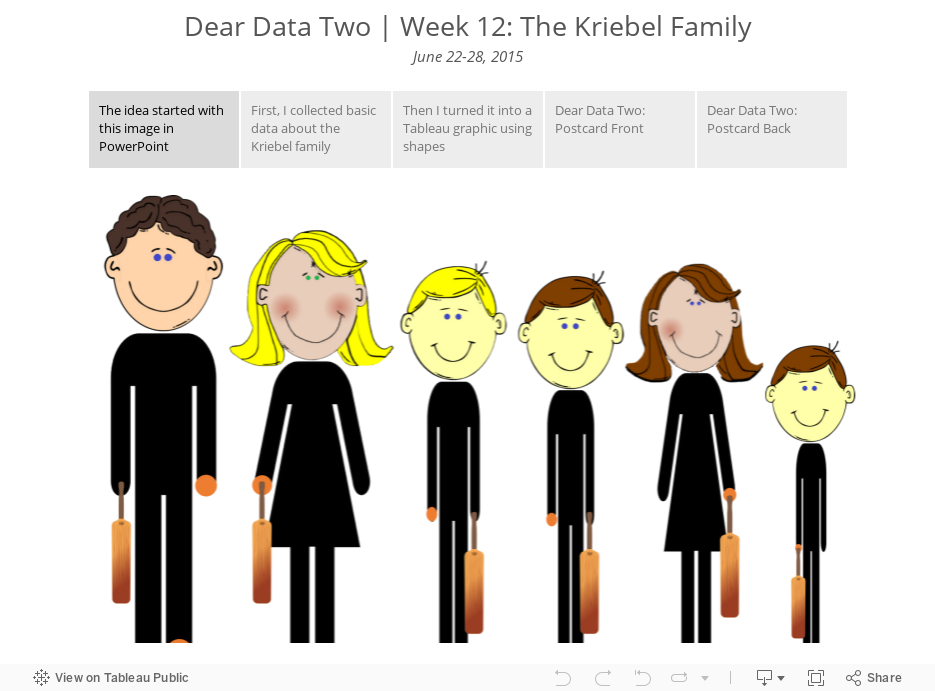
- Collection basic data about the characteristics of my family
- Use shapes in Tableau to create an infographic
- Translate the graphic to the postcard
July 25, 2015
Dear Data Two | Week 10: To-Do Lists

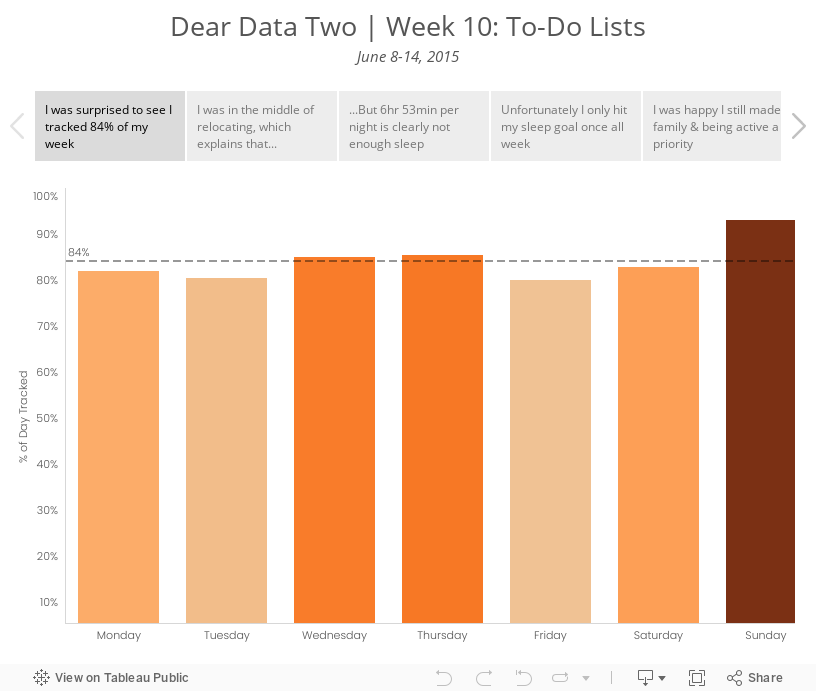
I decided to take a look at the specific activities I was performing. I ended up grouping them in more general categories to improve the visualisation; I prefer a bit more simplicity in my life as well as my vizzes. I used several methods for data collection this week: Swarm, Moves, Fitbit, Runkeeper, IFTTT, Sunrise Calendar. From there, I looked at a few specific categories:
- Overall rate of tracking - I was curious to see how much of my time I was actually able to account for.
- Relocation - I knew I was blowing off packing and the like, mostly because I hate it. The data proved this out.
- Sleep - Was the way I was feeling overall possibly due to a lack of sleep? I probably should have looked at sleep quality as well, but I didn’t include that data.
- Family time - Was I spending enough time with my family? This is always a huge priorty for me.
- Running - I was smack in the middle of marathon training. Was I completing my training? Was that impacting anything else?
- Work - Tom knew I wouldn’t be working much this week, but would I get ANY work done?
Given this set of goals, I explored the data in Tableau and created a few key stories. The last two tab in the story are images of the postcard.