Showing posts with label stress. Show all posts
January 3, 2016
Dear Data Two | Week 38: Negative Thoughts
circles
,
Dear Data Two
,
family
,
locations
,
negative
,
stacks
,
stress
,
thinking
,
thoughts
3 comments

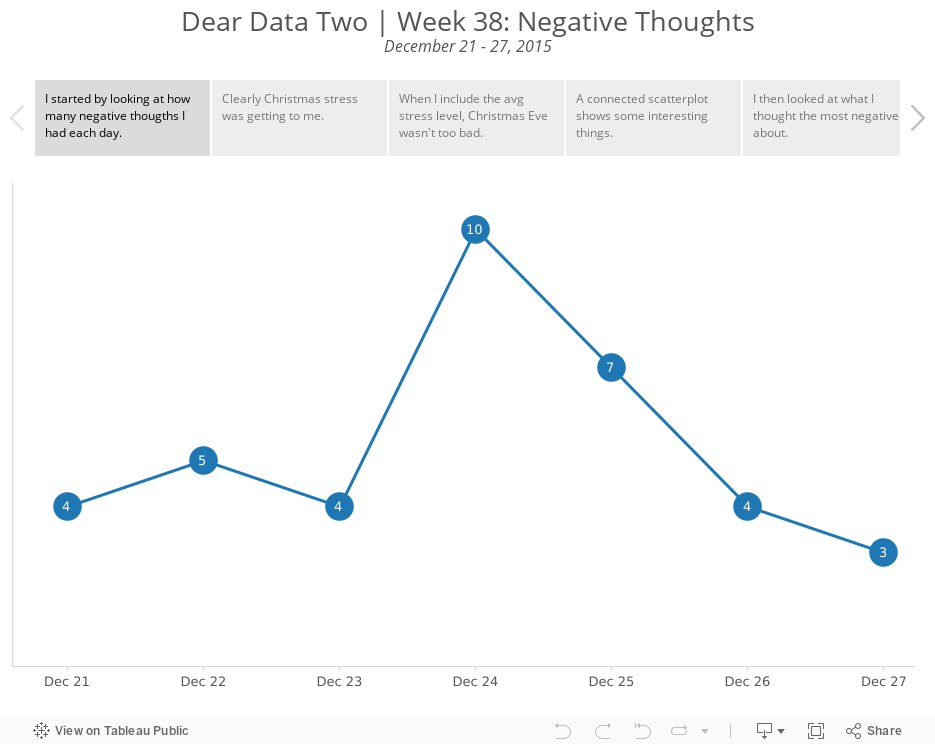
I tracked the date, what was on my mind, the general topic, where I was, who I was with, the stress level and what I was doing.
I tend to always look at what Giorgia and Stefanie produce each week as a way of looking for inspiration. This week, I really liked how Stefanie created piles for her negative thoughts.

Stefanie included a classification of inward/outward for each negative thought then split them up so you could see how much more there was on one side vs. the other. So I went back to my data and added a similar classification. More on this in a minute.
Here are some of the highlights from the data analysis I performed on my data:
- My inward negative thoughts more than doubled my outward negative thoughts. This means that I was keeping my negativity to myself more than expressing it to others. For me, this is good because I have always tended to just say whatever is on my mind. Does this mean I am learning to control myself a bit more?
- Most of the negative thoughts were me by myself. Otherwise, Beth was second most involved. This really isn't surprising given it was Christmas week, we went shopping together, and every year I get stressed about how much we spend on Christmas.
- 75% of my negative thoughts were low stress...phew!!
So back to the postcard. I thought Stefanie missed an opportunity to think about the "weight" of her negative thoughts. How could I represent my data on what looked like a scale? How could I incorporate more of the metadata? I came up with this Tableau viz:

What I tried to do was make the inward negative thoughts appear "heavier" than the outward negative thoughts by adjusting the y-axis. I was also able to include who I was with (inner circle) and the topic (outer circle).
For my postcard, I was able to make it look even more like a scale and I also was able to include where I was. This turned out to be a good example of how you can do way more by hand than you can with any software.
Explore the entire week in the Tableau story below, including my thought process for how I decided which data to put in the final viz.
December 29, 2015
Dear Data Two | Week 36: Indecision
anxiety
,
bar chart
,
circles
,
color
,
Dear Data Two
,
lollipop
,
marriage
,
shapes
,
stress
2 comments

- Who I was with?
- What stress level did it introduce?
- What was the major topic?
- How long will it take to resolve?
- Was it resolved by the end of the week?
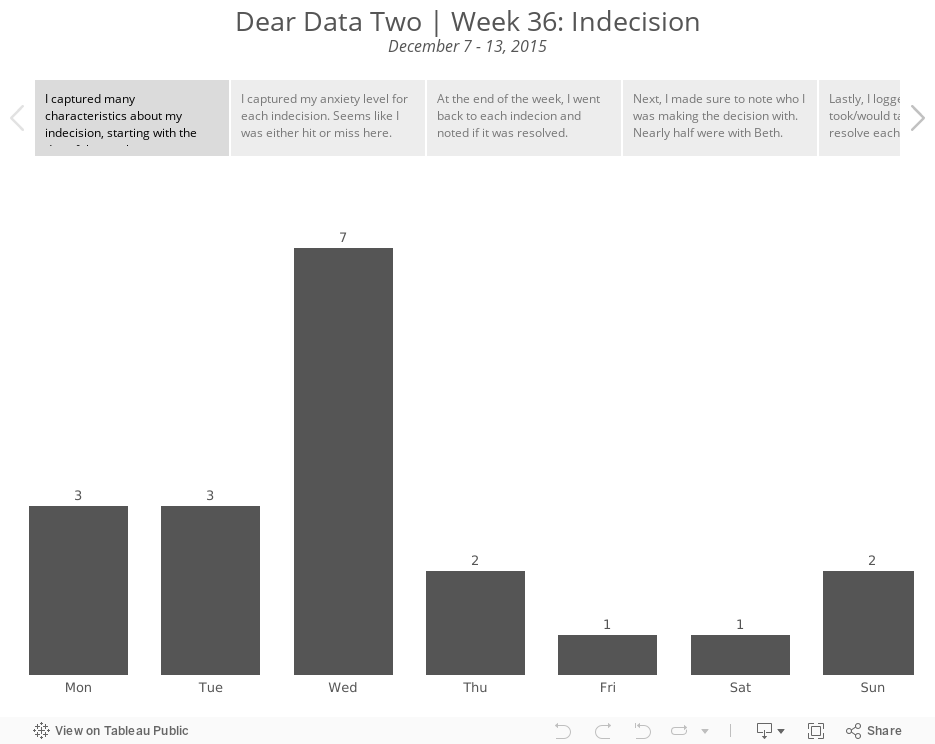
I'd never really thought much about my indecision before, so this proved to be quite an interesting exercise for learning more about what goes through my head. For the week, I logged a total of 19 indecisions. Of those 19:
- There was an even split (42%) between low and high anxiety levels. To me, that means that my decisions were either simple or hard, which doesn't surprise me as I'm a pretty much black or white kind of person.
- I was able to resolve 68% of my indecisions. I take that as a good sign that I follow up on things and try to not let things pester me for too long.
- As for who I was with, nearly half of the indecisions I logged were with my wife. That didn't strike me as unusual because it's really just a sign of a married couple making decisions together.
- 79% of my indecisions took days or less to ultimately resolve.
Ok, so what does all of this mean? Is there anything particular about the decisions I make with Beth?
The short answer is yes. 7 of the 9 records that include my wife I considered to be high stress decisions. But on the flip side, we were able to resolve 6 of the 9. That's a sign of a strong marriage, right? And those 3 that we didn't resolve? Well, those all had to do with money. And money is typically always the hardest thing to work out in a marriage. To me, this means we're normal.
As for the postcard, I wanted to create something similar to Giorgia's postcard for the week, with the swirls and all. And I also wanted to see if I could create the same effect in Tableau. I was able to get really close in Tableau.

Lastly, here is my entire Tableau analysis, plus my postcard. Enjoy!
Subscribe to:
Posts
(
Atom
)






