August 2, 2015
Dear Data Two | Week 11: Emotions

Week 11 could not have come at a more perfect time for me. I had so much going on in my life:
- Putting my family on a plane to Atlanta (before they headed to London a few weeks later)
- Saying my final goodbyes at Facebook
- Packing the rest of our stuff for storage
- Selling our car
- Saying goodbye to my sister
- Heading back to London
- Finishing prep for The Data School.
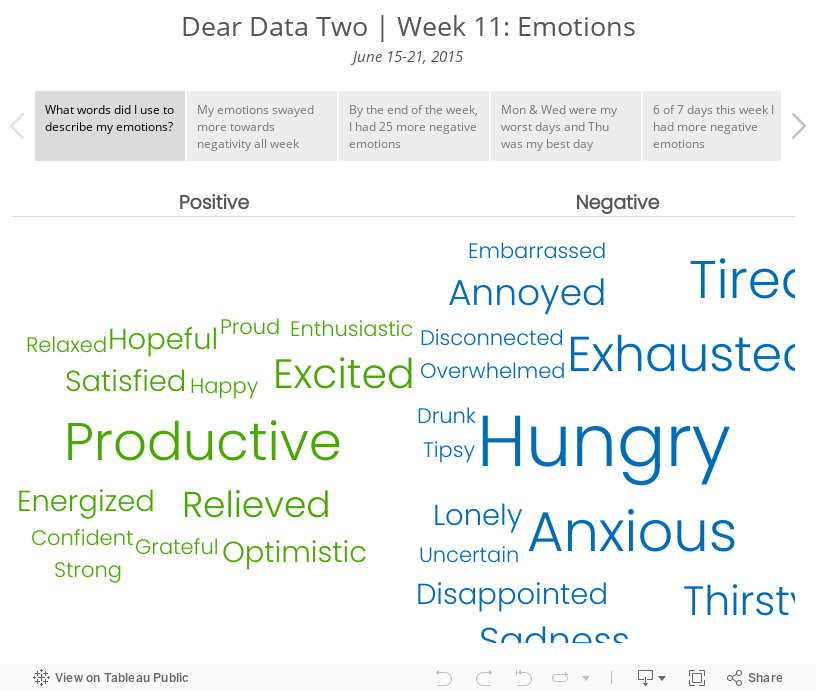
Throw in marathon training and needless to say, my emotions were all over the board. Basically, I was operating on fumes all week.
My data collection was pretty simple. Since I was already using IFTTT to log Swarm check-ins to Google Sheets, I simply added a column for my emotional state at the time of the check-in. I intentionally did not look back through the data until I was done because I didn't want to bias myself.
The summary is simple: I basically had the emotional state of an 6-month old. I found this to be a really fun analysis, one that I've never done before, and it gave me a very different insight into my week than I expected. Data for the win!
July 25, 2015
Dear Data Two | Week 10: To-Do Lists

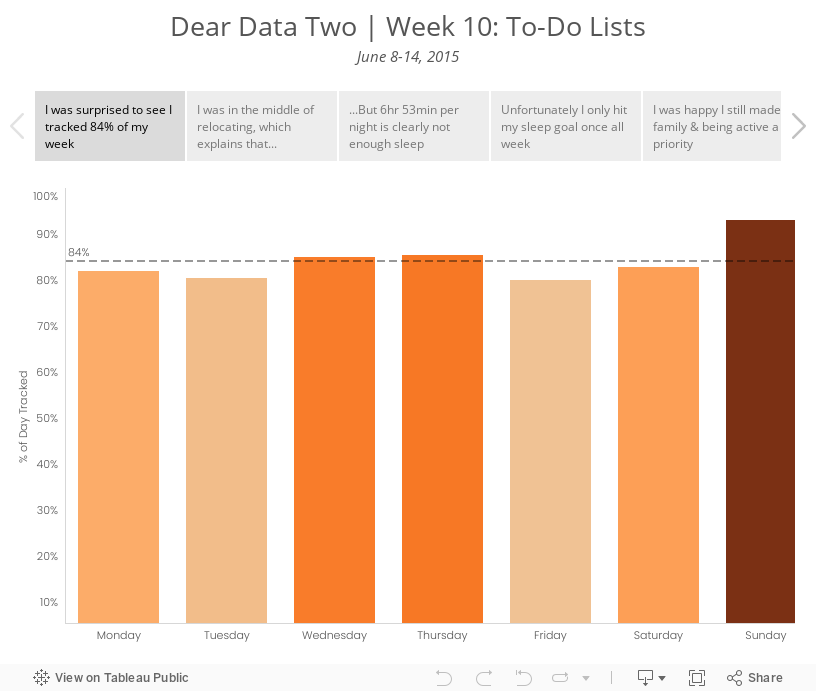
I decided to take a look at the specific activities I was performing. I ended up grouping them in more general categories to improve the visualisation; I prefer a bit more simplicity in my life as well as my vizzes. I used several methods for data collection this week: Swarm, Moves, Fitbit, Runkeeper, IFTTT, Sunrise Calendar. From there, I looked at a few specific categories:
- Overall rate of tracking - I was curious to see how much of my time I was actually able to account for.
- Relocation - I knew I was blowing off packing and the like, mostly because I hate it. The data proved this out.
- Sleep - Was the way I was feeling overall possibly due to a lack of sleep? I probably should have looked at sleep quality as well, but I didn’t include that data.
- Family time - Was I spending enough time with my family? This is always a huge priorty for me.
- Running - I was smack in the middle of marathon training. Was I completing my training? Was that impacting anything else?
- Work - Tom knew I wouldn’t be working much this week, but would I get ANY work done?
Given this set of goals, I explored the data in Tableau and created a few key stories. The last two tab in the story are images of the postcard.
June 13, 2012
Are you considering relocating to another country? Maybe one of these cities is a good fit.
Timely that Mercer published its World Cost of Living Survey yesterday (12 June 2012) as I’ll be moving to San Francisco soon for a super cool data viz opportunity with Facebook. I thought for sure that San Francisco would be in the top 50 (we had some serious sticker shock look at houses out there!!), but it’s not.
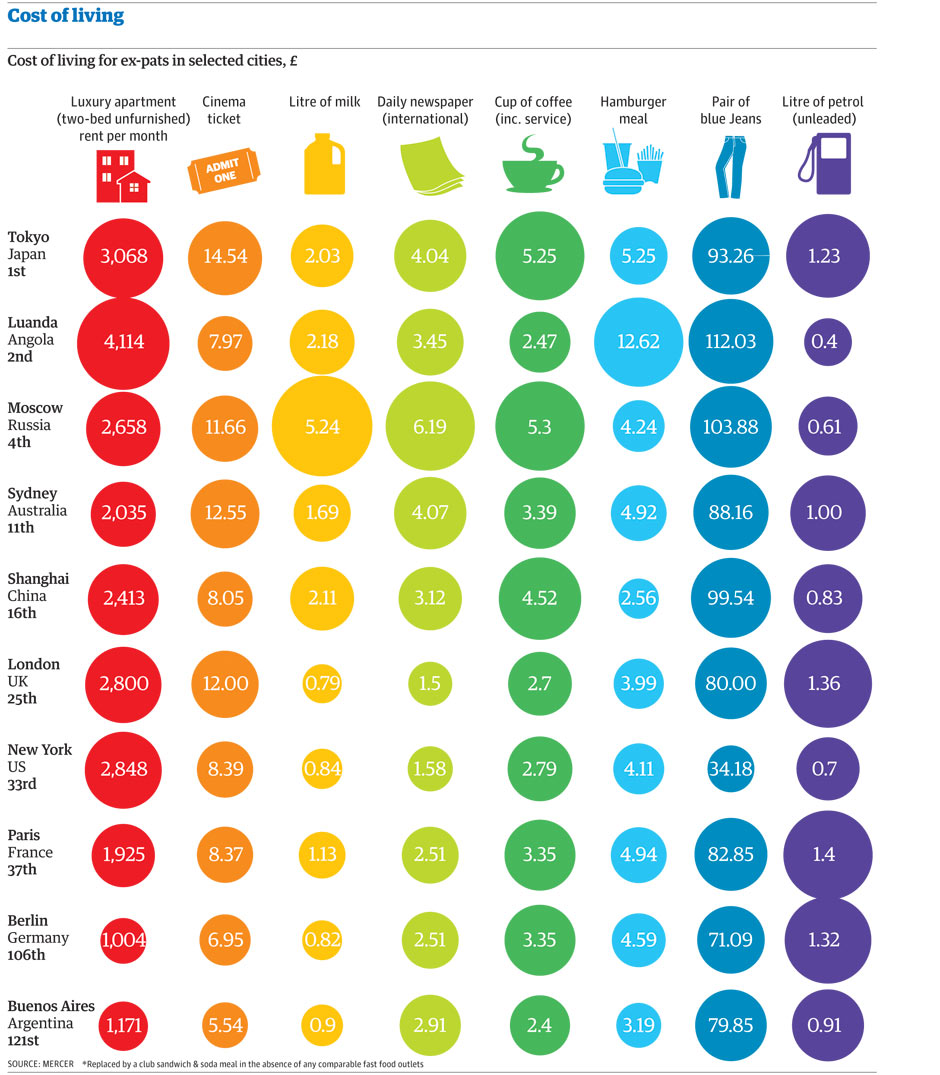
Select data was released by the Guardian. They posted this infographic (click to enlarge), but I found it a bit difficult to circumnavigate. It’s challenging to find patterns and compare the data. For me, there’s too much information in one view. It’s good for an overview and to print, but challenging for analysis.
Note that the data is a subset of countries; it does not represent the top 50.
I downloaded the data and built this simple viz in Tableau.

I wanted to be able to compare countries and two expenditures simultaneously, so I used Tableau’s parameters feature to allow you to choose the what you want to compare.
I intentionally included both a map and scatterplot so that you have multiple methods for comparing the data. Click on a country on the map or a circle in the scatterplot to highlight the country. Hover over a circle for more information.
The 2nd tab is a reproduction of the infographic the Guardian produced. It’s for reference only. I doubt you can glean much insight from it.
There are some expenditures that I would have expected to correlate highly that don’t. Blue jeans vs. cinema is a good example of this. Or a cup of coffee and a newspaper. Don’t those two go hand in hand?






