October 17, 2023
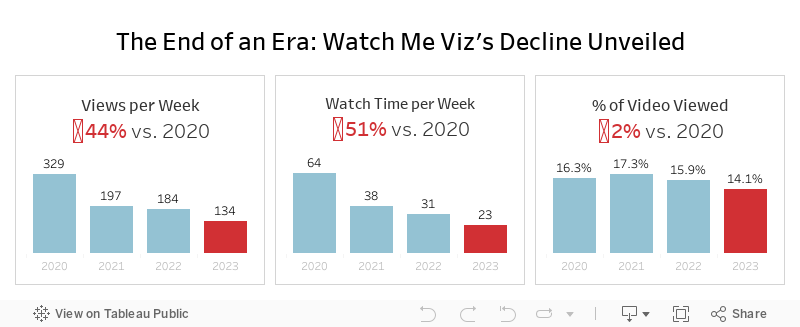
The End of an Era: Watch Me Viz's Decline Unveiled

That's a wrap. Watch Me Viz has retired, for good.
This week's data was about the performance of all of the WMV livestreams. There was some incredible viewer participation, which ultimately led to this viz that explains why WMV should quietly disappear.
Check out the livestream below.
March 3, 2018
Creating Runkeeper Tile Maps with Alteryx & Tableau
- Login to Runkeeper
- Go to "Account Settings" from the gear at top right of the screen
- Choose the Export Data option on the left
- Select the date range
- Click on Export Data
- Unzip the files
To get all of your routes from Strava:
- Login to Strava
- Select "Settings" from the main drop-down menu at top right of the screen
- Select "Download all your activities" from lower right of screen
- Wait for an email to be sent
- Click the link in email to download zipped folder containing activities
- Unzip the files
I actually don't follow either of these methods. I pay a small yearly fee for a service called Tapiriik that allows you to sync your fitness data with Dropbox.

ALTERYX WORKFLOW

Steps
- Input all of the files using a wildcard match for 2018 runs only.
- Assign a unique number to every row. In these files there's a GPS reading every second. Having a unique number makes creating the routes easier because you know the sequence.
- The next few steps are the magic part. These essentially give every route the same size as a square. We need them all to be the same size regardless of the actual geographical area covered.
- Create points for each GPS points and connect them to create a polyline. Do this for both the route itself and the boundary
- Calculate some summary stats for each run.
- Bring them all back together.
- Export as a SHP file.
TABLEAU VISUALIZATION
1. Small Multiples

2. Calendar View
- Double click the Geometry field to get a map
- Filter to a single month
- Place Weekday on the Columns
- Week on the Rows
- Add information for tooltips
- Add total monthly mileage to the caption
- Resize the rows and columns to fit the window

LESSONS LEARNED
- Leverage the strength of your team to help you solve a problem and to help you learn.
- Alteryx makes creating and working with spatial objects incredibly simple.
- Prepping the data exactly as you need it in Tableau will make the visualization process much faster.
- Data prep processes in R and Python make for great data prep exercises in Alteryx.
- Fail fast and iterate quickly. Both Alteryx and Tableau allow you to try lots of things quickly without fear of breaking anything. Try something. If it doesn't work, try something else. Keep going until you've nailed it.
June 22, 2017
Makeover Monday: Tiled Heatmap of U.S. Air Quality Levels
I was very interested in looking at state-level air quality and built lots of heatmaps and originally built them in a single worksheet using table calcs to sort out which states go in which columns and rows.
This didn't work for me, though, because it only helped me see the states alphabetically. It's much more intuitive if they are displayed geographically. An idea popped into my head...
I wonder if I can combine a heatmap that looks at daily max reading by state across all years with a tile map.
I quickly went to Matt Chambers' great post for how build tile maps added the secondary data source, blended it by state and replaced my crazy table calcs with a simple tile map view. What a fun exercise! I learned a ton and feel like I created a much more intuitive view. Does anyone recall every seeing a tiled heat map? Have I come up with a new chart type???
Click on the image for the interactive version. Note that the viz might be slow to load as it's displaying about 460,000 marks.
April 8, 2016
Abortion Regulations - State by State | Hexmaps in Tableau
 |
| Click the image to interact |
Hexmaps…I’ve seen so many great examples of them created in Tableau (and other tools) like this one from Matt Chambers, this one from Ben Moss or this one from Kris Ericsson. Then I saw an article on the Washington Post about abortion regulations that included this series of tile maps...
 |
| Click the image to go to the original |
…and thought this would look much better a series of hexmaps. In addition, I’d never created one before and I wanted to learn how. Fortunately Matt Chambers wrote a blog post for how to create them. I downloaded his workbook, copied the data into Excel, and add the columns I needed. I’ve saved an Excel template you can download here and all you need to do is add the columns you want to use on the color shelf in Tableau.
For my version, I wanted to create a small multiples view with a matrix that shows all states and their regulations in a table you can click to highlight. Special thanks to Robin Kennedy and Matt Chambers for their feedback!!
Two vizzes in one day, two new techniques learned. I’ll chalk it up as a fabulous day!






