Showing posts with label polyline. Show all posts
June 19, 2020
How to Get Your Data from Strava to Tableau
Alteryx
,
density
,
heat map
,
heatmap
,
line
,
linear geometry
,
lines
,
linestring
,
map
,
Mapbox
,
maps
,
polyline
,
simple mass downloader
,
small multiples
,
tableau
No comments
UPDATE: If you prefer video tutorials, there is now one on my YouTube channel here. The steps to get the links into the Simple Mass Downloader are done more efficiently in the video. There are several steps removed from the Excel and link uploads that are listed in the blog.
For a while now, I've been using this process for getting my data from Strava into Tableau like this:
- Download the data from Strava
- Prep it with Alteryx
- Visualize it in Tableau
In this post, I will outline the steps for getting your data from Strava into Tableau. I have also created a template with some sample vizzes for you to use. Download it from Tableau Public here.
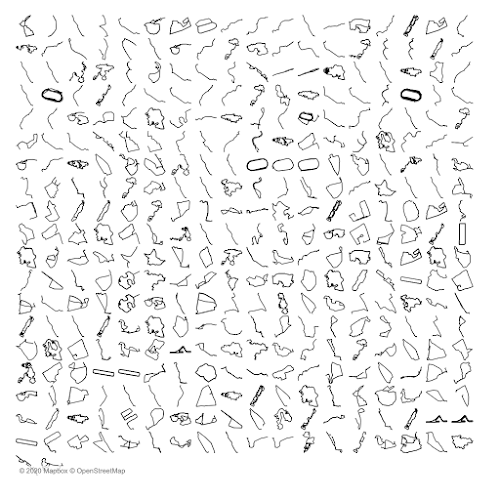
I started revamping the process after wanting to create a small multiple view of all of my activities like this:


Step 4 - In step 2, choose Request Your Archive. Don't do anything else on this page.

When I first started creating these, I took a process based on R and converted it into a workflow in Alteryx. This worked great, but there were two main drawbacks:
- My Alteryx workflow was a mess (I tinkered with it every month).
- Each of the routes would be adjusted to fit perfectly in a square.
This second problem meant that the routes were not scaled correct according to the curvature of the Earth. I then saw that Andy Cotgreave reached out to Ken Flerlage for help. They've written about their process here. Great! However, the calculations on this process make rendering the maps in Tableau very, very slow. Like REALLY slow.
That's where Alteryx comes in. I pushed all of the data processing into Alteryx, export each route as a single spatial object and every renders super fast. So if you're interested in getting all of your data out of Strava and visualizing it in Tableau, this process is for you. It does require Alteryx, but you could replicate the process in R.
TOOLS REQUIRED
- A Strava account - NOTE: Make sure you are logged in to Strava throughout these steps.
- Alteryx Designer
- Tableau Desktop
- Simple Mass Downloader Chrome extension
GET THE DATA FROM STRAVA
Step 1 - Login to Strava, click on your profile icon on the upper right, choose Settings.

Step 2 - On the My Profile page, click on My Account.

Step 3 - Scroll to the bottom and click on the Get Started button in the Download or Delete Your Account section.


Step 6 - Unzip the file that downloads. Open the folder that's created and you should see something like this.

The activities folder contains all of the raw files, but these won't all be in the same format, which means they're useless. The ONLY file we need is activities.csv. Open the CSV in Excel.
Step 7 - The only column we need in the file is the Activity ID column.

Delete all columns except Activity ID.

Step 8 - Insert a column to the left of Activity ID. I name it URL, but call it whatever you prefer. Then in cell A2 enter this formula:
=CONCAT("https://www.strava.com/activities/",B2,"/export_gpx")
Then copy it down for all rows. This create a link to each activity in GPX format. If some of the activities don't have location data, don't worry about it. Those will simply not download in the process.

Choose the URL column header (the "A" above URL), choose Copy, then Paste Special => Values. Then delete column B (the column with the activity ids).

DOWNLOAD EACH ACTIVITY
Step 1 - Add the Simple Mass Downloader Chrome extension.

A new tab will open with a tutorial if you're interested to learn how it works.
Step 2 - Click on the extension button and you should see this screen.

Step 3 - Click on the hamburger on the right and choose Import URLs from local file.

Step 4 - Import the activities.csv file and the URLs will upload. This loads all of the files into the queue on the Download List tab. Choose the Select All box and they should all be highlighted.

Step 5 - Click on Start Selected and you'll see a bunch of files start downloading very quickly. Again, some of them will error out if the activity doesn't have location data. The files that download will have a green check next to them.

Phew! That might seem like a lot, but once you do it a couple times, the process is really quick.
Fantastic...all of the files are now downloaded. Onto Alteryx we go.
ALTERYX PROCESS
Step 1 - Download the Strava Route Maps workflow from the Alteryx Gallery and open it in Alteryx Designer. If you can't download it from the Gallery, I have it on Google Drive here.

The Strava icon is a simple macro that will import all of the GPX files in the Directory you specify when you run the app.
The workflow is split into four parts:
- Import the data, strip out the parts we need, then create points and lines.
- Normalize the data based on the calcs from Ken Flerlage, turn them into lines (one mark for each route rather than hundreds of point for each route) and export as a Tableau extract.
- For each point, calculate the distance, climb, etc. and extract all of the points.
- Take each of the points and turn them into lines.
Neither part 3 nor part 4 above normalize the data into squares. These are simply all of the data for each route.
Step 2 - Run the workflow as an App by clicking on the magic wand next to the Run button.

Step 3 - Choose the folder that contains all of the GPX files from the Simple Mass Downloader output. And click Finish.

This will generate three Tableau extracts that will load into the same directory as the GPX files. The workflow extracts them as TDE because Hyper files don't support polygons. Even though these aren't polygons, it makes me more comfortable that Tableau will read the files correctly.
Success!

Click the Clear button and then the OK button. Otherwise all three files will open in Tableau, which we don't want.
We're all done with Alteryx. Onto Tableau.
TABLEAU PROCESS
I've created a template for you to get started with. Download it from my Tableau Public profile here. Once you have done that, follow these steps.
Step 1- Open Tableau and right-click on each data source and pick Edit Data Source.

Step 2 - Click on the carrot next to the data source name and choose Edit Connection.

Step 3 - Navigate to the data source that downloaded from the Alteryx workflow. It will have the same name.

Step 4 - Go back to your worksheets and everything should update automatically. If not, right-click on the data source name and choose Refresh.
Step 5 - Customize the views as you see fit. That's it!
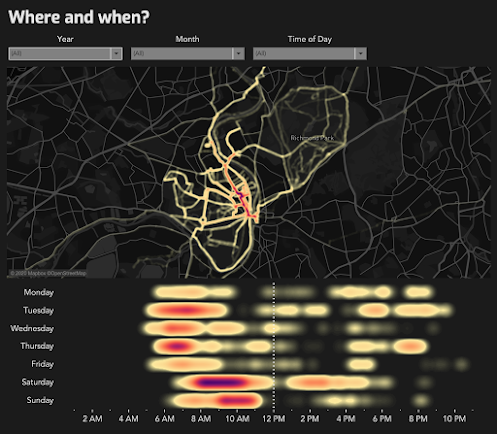
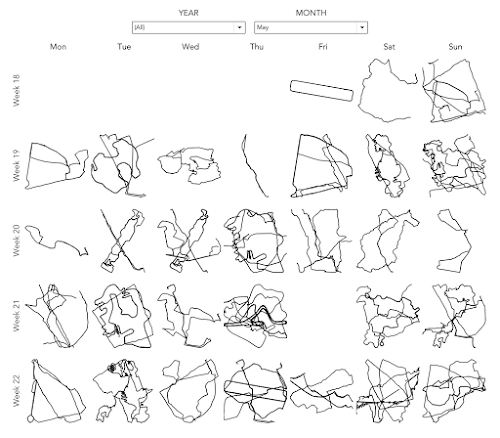
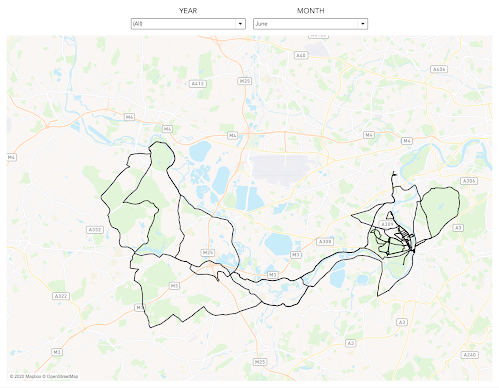
Here are the vizzes that I have included in the template.

March 3, 2018
Creating Runkeeper Tile Maps with Alteryx & Tableau
In this post, I'll detail how I created the tile maps and share the workflow and visualizations. The inspiration for this project comes from Marcus Volz and his great github tutorial on how to create small multiple visualizations of your Strava runs, which I wrote about here. This was the viz that I created based on his R code:
 When I visited The Information Lab France in January, we decided that we would try to replicate Marcus' process with Alteryx and Tableau because we wanted it to be an interactive visualisation, whereas Marcus' creates a static image. This process should work for Runkeeper, Strava or any fitness app that uses GPX files.
To get all of your routes from Runkeeper:
- Login to Runkeeper
- Go to "Account Settings" from the gear at top right of the screen
- Choose the Export Data option on the left
- Select the date range
- Click on Export Data
- Unzip the files
To get all of your routes from Strava:
- Login to Strava
- Select "Settings" from the main drop-down menu at top right of the screen
- Select "Download all your activities" from lower right of screen
- Wait for an email to be sent
- Click the link in email to download zipped folder containing activities
- Unzip the files
I actually don't follow either of these methods. I pay a small yearly fee for a service called Tapiriik that allows you to sync your fitness data with Dropbox.

ALTERYX WORKFLOW

Steps
- Input all of the files using a wildcard match for 2018 runs only.
- Assign a unique number to every row. In these files there's a GPS reading every second. Having a unique number makes creating the routes easier because you know the sequence.
- The next few steps are the magic part. These essentially give every route the same size as a square. We need them all to be the same size regardless of the actual geographical area covered.
- Create points for each GPS points and connect them to create a polyline. Do this for both the route itself and the boundary
- Calculate some summary stats for each run.
- Bring them all back together.
- Export as a SHP file.
TABLEAU VISUALIZATION
Once the shapefile is done, all you need to do is connect to it in Tableau. I created two visualizations. Click on the images for the interactive versions and to download the workbook.
1. Small Multiples
Like Marcus' viz, I created a view that spaces the runs based on the number of runs in the view. For example, in February, I recorded 22 runs, so I get a view with 5 rows and 5 columns. Each square has a route from the first run on the upper left to the most recent run in a Z pattern. There are additional details about each individual runs available on hover.
This view uses table calculations to determine the spacing.

2. Calendar View
The calendar is much simpler to create since it doesn't need any table calcs.
- Double click the Geometry field to get a map
- Filter to a single month
- Place Weekday on the Columns
- Week on the Rows
- Add information for tooltips
- Add total monthly mileage to the caption
- Resize the rows and columns to fit the window

LESSONS LEARNED
I'm nowhere near an expert in Alteryx. I know I can improve if I practice more. Here are five lessons learned I learned that I will be taking forward:
- Leverage the strength of your team to help you solve a problem and to help you learn.
- Alteryx makes creating and working with spatial objects incredibly simple.
- Prepping the data exactly as you need it in Tableau will make the visualization process much faster.
- Data prep processes in R and Python make for great data prep exercises in Alteryx.
- Fail fast and iterate quickly. Both Alteryx and Tableau allow you to try lots of things quickly without fear of breaking anything. Try something. If it doesn't work, try something else. Keep going until you've nailed it.
Subscribe to:
Posts
(
Atom
)






