VizWiz

Launch, grow, and unlock your career in data
Showing posts with label makepoint. Show all posts

January 22, 2025

L-Shaped Bars: The Chart You Didn't Know You Needed

No comments
In this Tableau tutorial, I’ll walk you through how to create L-shaped bar charts, a unique and visually way to display your data, perfect for giving your dashboards a fresh, modern look.

You’ll learn:

- How to connect and prepare your data using Superstore and custom point files.
- Creating relationships and calculated fields to build the L-shaped structure.
- Using Tableau’s Map Layers feature to add detail and customization.
- Formatting and finalizing your chart for dashboards.

Whether you’re impressing stakeholders or sharpening your Tableau skills, this step-by-step guide has you covered!

Resources:
🔗 Point data files
🔗 Tableau workbook


P.S. Want to become an advanced Tableau user?

Unlock your full potential with Next-Level Tableau, the ultimate training program for Tableau users. Gain access to expert-led tutorials, live sessions, and a supportive community designed to help you master advanced skills, create stunning dashboards, and achieve your career goals. Learn more and take your Tableau skills to the next level today at nextleveltableau.com.

Unsure? Sign up for my free course at starter.nextleveltableau.com.

December 17, 2024

No comments

Learn how to build a stunning waffle chart in Tableau using map layers and calculations! 

This advanced Tableau tutorial will show you how to simplify the creation of waffle charts while unlocking powerful design and flexibility for your data analysis projects.

You’ll Learn How To:

- Connect Tableau to Superstore and a waffle chart template with Relationships

- Use the MakePoint function to create dynamic map-based charts

- Apply map layers for advanced customization and perfect label placement

Why You Need This:

This method combines advanced Tableau charts with the flexibility of map layers, allowing you to:

1. Create precise grid-based waffle charts.

2. Perfectly center labels without complex workarounds.

 Who Is This For?

- Data analysts looking to enhance their Tableau dashboards

- Advanced Tableau users exploring new chart techniques

🔗 Workbook  |  Data

Become a Next-Level Tableau member and become a Tableau expert


January 25, 2022

How to Calculate the Distance Between Two Points
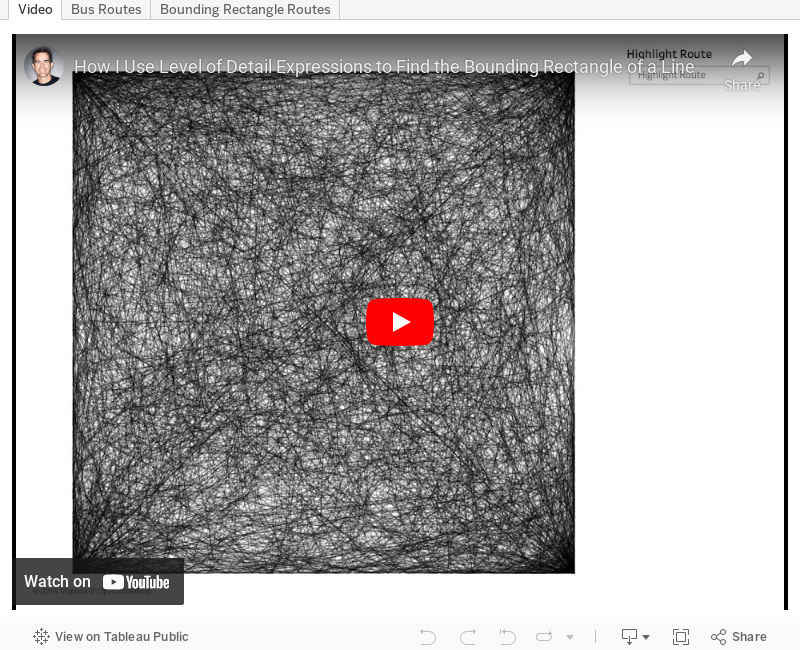
No comments
In this tip, I show you how to use the Distance function in Tableau to calculate the distance between two points. I also show you how to use the Makepoint and Makeline functions to draw the map. 

Download the data set to follow along here - https://data.world/vizwiz/airport-to-airport-routes

December 17, 2019

#TableauTipTuesday: How to Use Level of Detail Expressions to Find the Bounding Rectangle of a Line

No comments
In this tip, I show you how to use level of detail expressions to find the boundaries of a line and turn it into a square by finding the ratio of each point on the line to the width and the height.

Note: A couple of the calculations were backwards in the video, so download the workbook to ensure you have them correct.
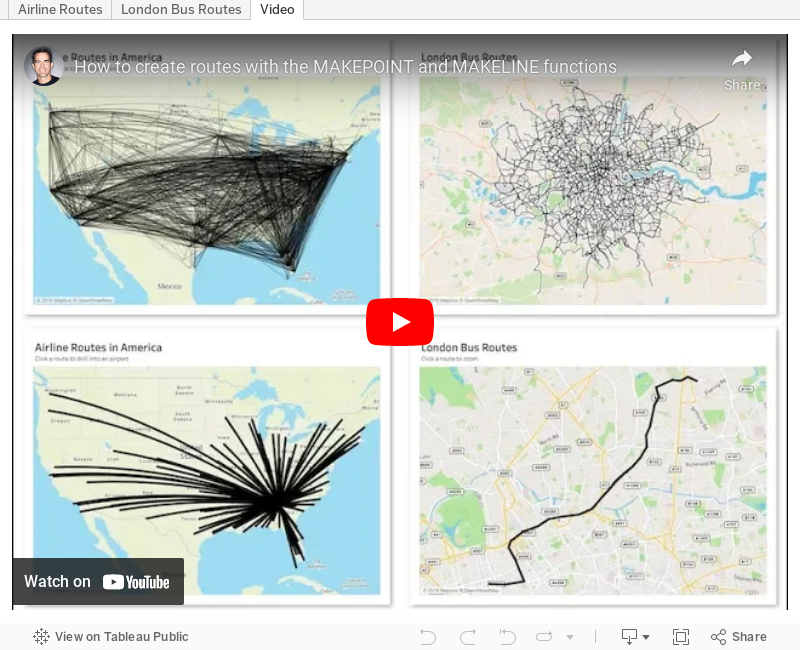
June 18, 2019

#TableauTipTuesday: How to create routes with the MAKEPOINT and MAKELINE functions

No comments
In this week's tip, I show you how to use the makepoint and makeline functions that became available in Tableau 2019.2 to create routes. I show two examples: airline routes, and bus routes. The bus routes also shows you how to use a calculated join to bring one row up to the previous row.

Leave a comment if you have any questions.