December 17, 2019
#TableauTipTuesday: How to Use Level of Detail Expressions to Find the Bounding Rectangle of a Line
Note: A couple of the calculations were backwards in the video, so download the workbook to ensure you have them correct.


June 18, 2019
#TableauTipTuesday: How to create routes with the MAKEPOINT and MAKELINE functions

Leave a comment if you have any questions.
December 17, 2018
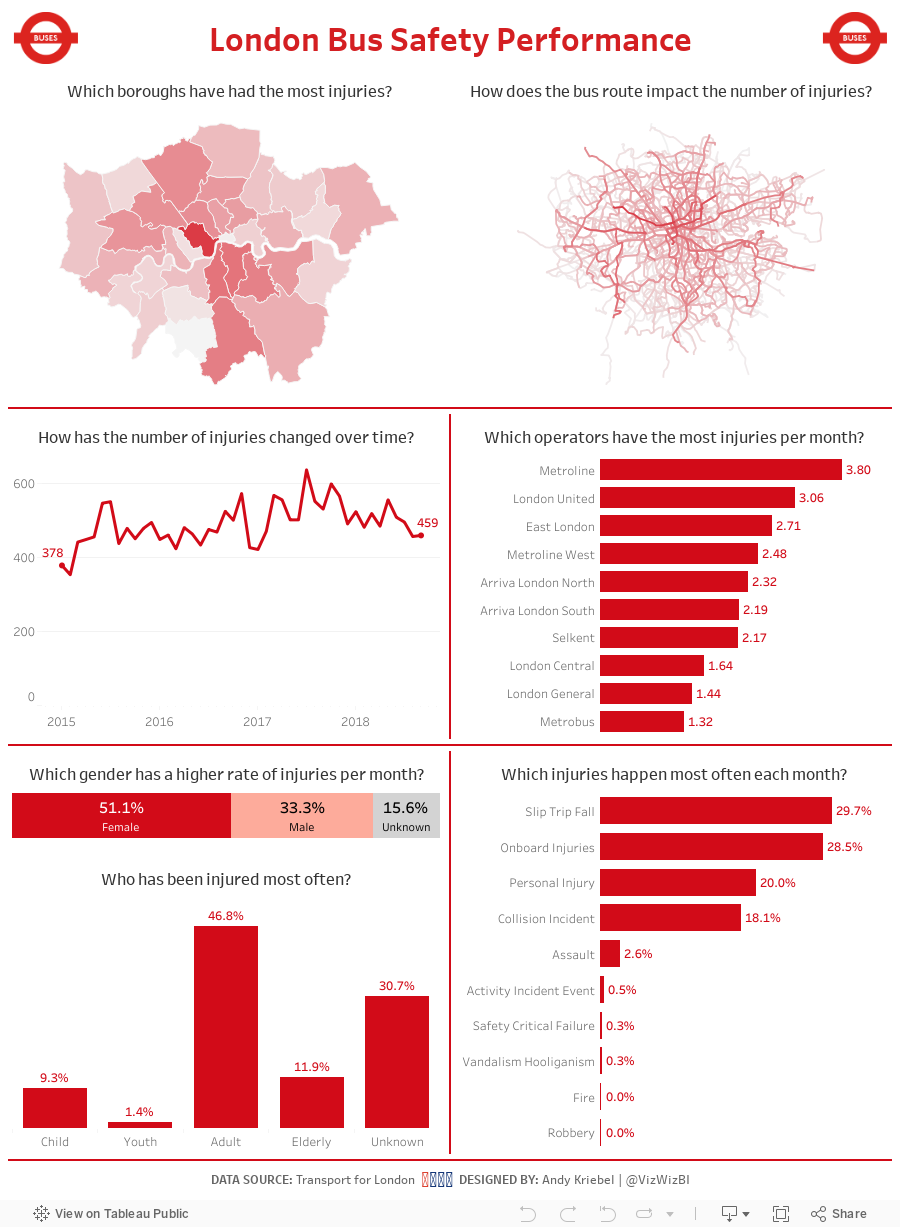
Makeover Monday: London Bus Safety Performance

So, to get back at them, I gathered all of the bus injury data from Transport for London and gave it to all of you, the Makeover Monday Community, to help make their scorecards better. What does the scorecard look like now?
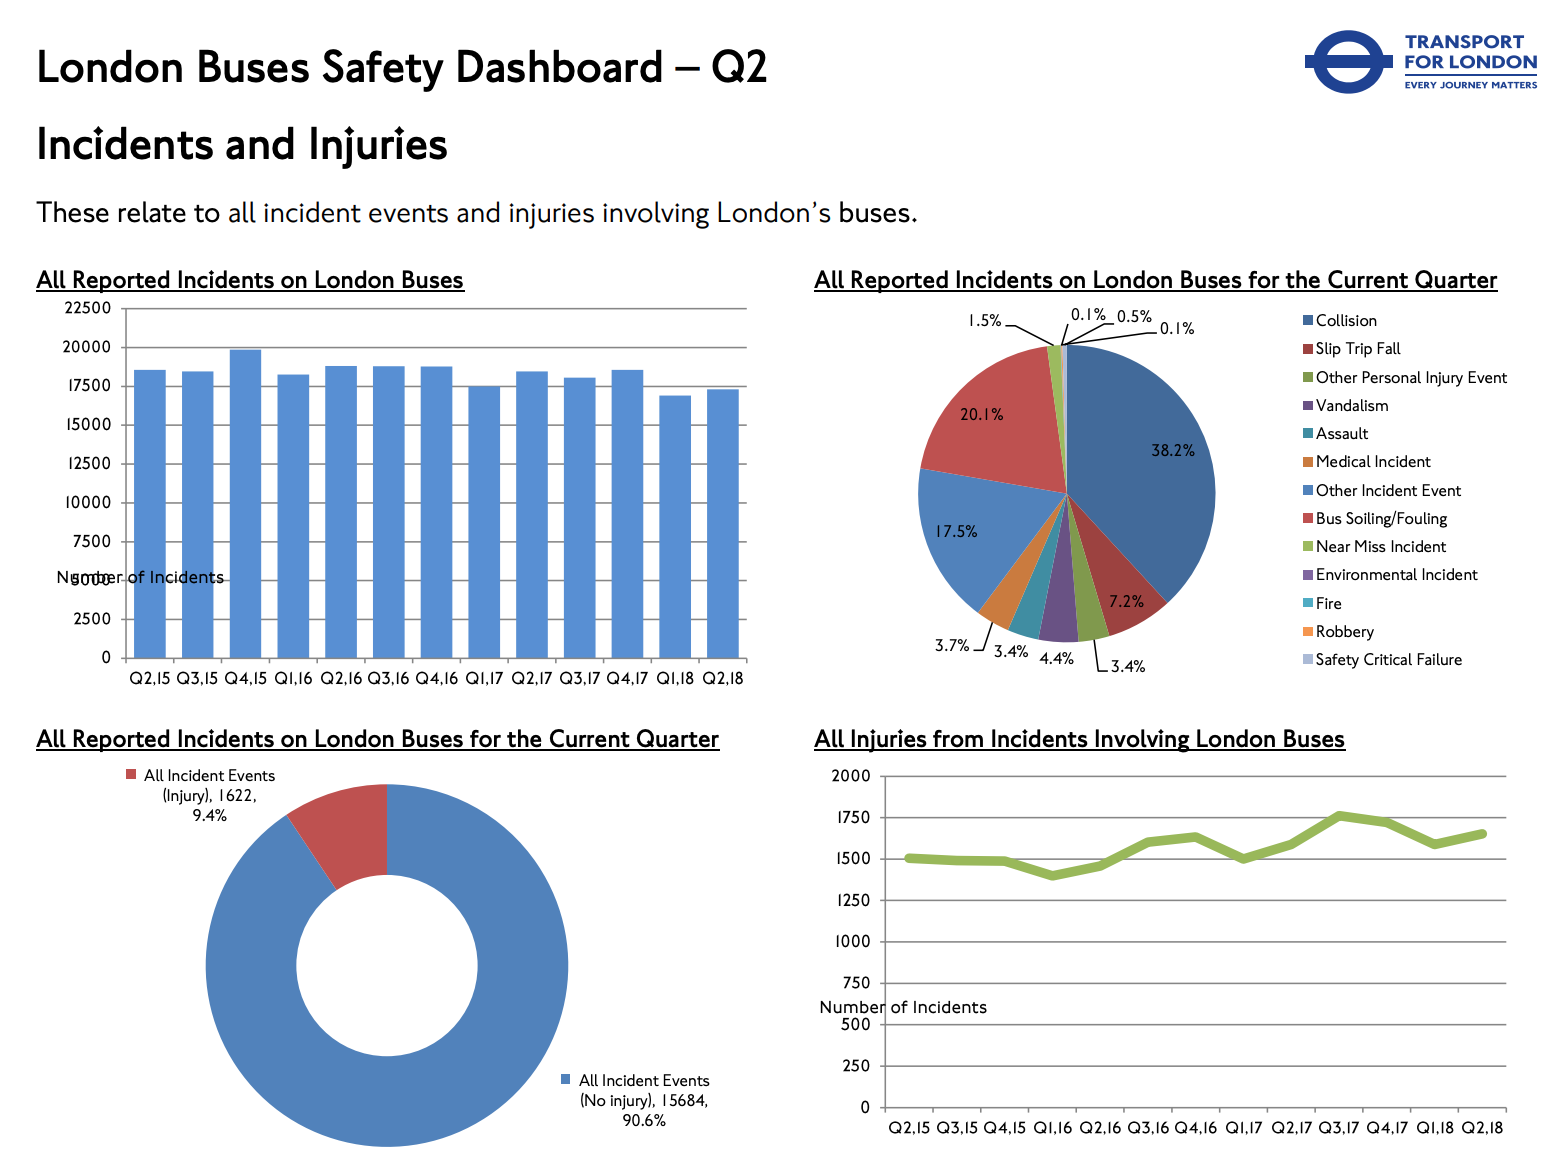
What works well?
- The line charts are easy to understand.
- All charts have good titles.
- The donut chart is clear and simple.
- The colors work well together (except the pie).
What could be improved?
- The pie chart could be made into a bar chart.
- The charts could use more context.
- The data is horribly delayed (it's December 17th as I write this and the data only goes through June).
What I did
- Give the user an opportunity to explore the data; every chart has action filters
- Use TfL colors
- Provide context on some of the charts, like injuries per month
September 29, 2017
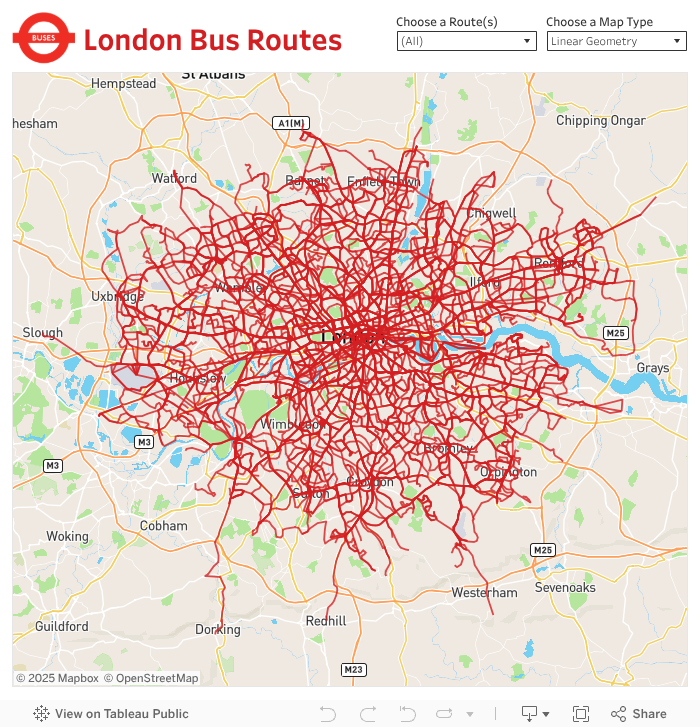
London Bus Routes - The Benefits of Linear Geometries in Tableau 10.4
- Plot each bus stop and connect the dots, or
- Create a single line for the entire path
Plotting Each Bus Stop
Using Linear Geometry
Which should you use?

I used this tip by Rob Suddaby from when he was in The Data School to convert the Eastings and Northings into a spatial object. From there it's simple to create either the linestrings for the entire route or points for each stop.
A quick Mapbox map added for context and we're done! One additional twist I added was to size the bus routes on the map based on the number of routes selected. This only works on the map with each individual stop. I'll be sharing this tip during my TC session in Vegas.
Have a play...enjoy!
December 18, 2016
Makeover Monday: Historical Performance of the Washington Metro

Two weeks to go in one of the best projects I’ve ever been a part of. In fact, Andy Cotgreave and I are hosting a Twitter chat on Monday at 4pm GMT. Get all of the details here and join us in discussing the impact this amazing project has had on all of us.
For week 51, we’re looking at the Washington DC Metro Scorecard. This is basically a KPI dashboard of quality and safety for the Metro. Let’s have a look at their scorecard:


What works well?
- Nearly laid out and organized
- Thumbs up and down give the status at a glance
- Despite the rings, it’s visually appealing and draws you in
What could be improved?
- While the rings make the comparison to goal easy, they wouldn’t work if something has to go past a full circle of the ring.
- Inconsistent colors
- No sense for performance over time
- Can’t see all of the metrics in a single view; scrolling is generally a problem with KPI dashboards
- You can’t tell how far each metric is from the target
They didn’t make all of the data available for us to use in the makeover. For example, there is no data available for the entire people and assets section. So what you’ll see this week from everyone will be nine of the metrics. For my makeover, I wanted to create small multiples of each metric over time. I liked their blue and red colors, so I used similar colors. I also wanted this to look more like a newspaper, so I went with the American Typewriter font. Lastly, if you look at this on a phone, you’ll see it a long, scrolling dashboard. I really like how this turned out.
March 30, 2016
Converting Eastings and Northings into a Tableau Transport for London Bus Route Finder Using Alteryx

Today my son Oscar came to work with me to spend time with the Data School and give them an assignment. He asked them to download the Transport for London data and find something interesting. I paired Oscar with Ben Moss and they wanted to look at the busiest times for busses. Oscar will publish his work on his Tableau Public profile when he’s done.
Oscar then wanted to take the bus route information and plot the routes on a map. The data include eastings and northings and we need to somehow turn these into points on a map. Tableau doesn’t understand these as geographic dimensions, but fortunately Rob Suddaby had just written a blog post on how to do this with Alteryx.
Super duper simple!!


