October 20, 2020
#TableauTipTuesday: Four Methods for Creating Dots on a Map

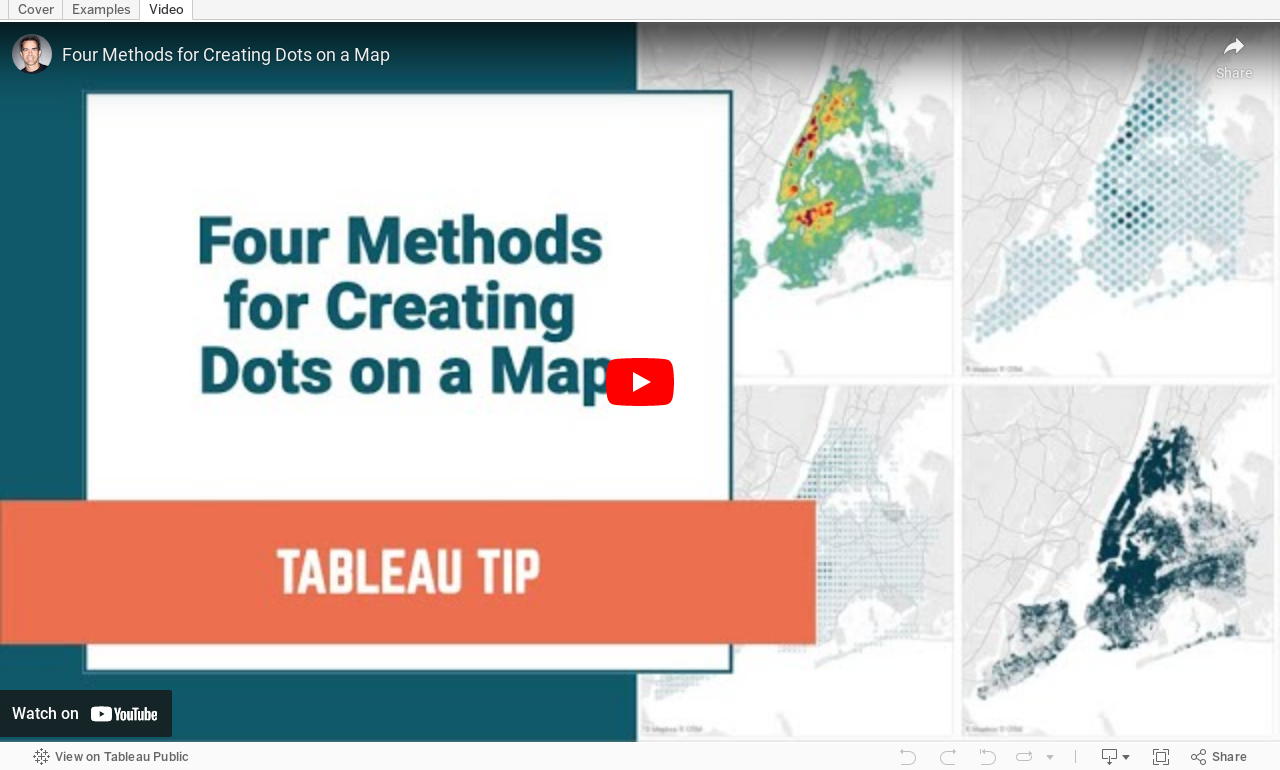
People love maps. Putting dots on a map gives a sense of precision. There are lots of methods for displaying maps. In this video, I show you four:
- The exact locations
- Density map
- Using the ROUND function to generalize the points
- Using the HEXBIN functions to generalize the points, but at a level controllable by the user
December 17, 2019
#TableauTipTuesday: How to Use Level of Detail Expressions to Find the Bounding Rectangle of a Line
Note: A couple of the calculations were backwards in the video, so download the workbook to ensure you have them correct.

August 21, 2017
Makeover Monday: The Monthly Latitude Range of Solar Eclipses by Century
This week we looked at this viz of thousands of years of solar eclipses:

What works well?
- Fantastic interactivity and drill down capabilities
- Showing the paths of each eclipse along with the partial eclipse breadth
- Coloring each eclipse type
- Leveraging Google Maps so the user can customize the map to their preference
- Good explanations above and below the chart
What could be improved?
- Remove the labels on each line to declutter the map
- Avoid a repeating map
- Include a more impactful title
My Goals
- Explore the data to find some interesting analysis per Eva's request
- Build lots of views to see what pops
- Simplify the view to reduce complexity and clutter
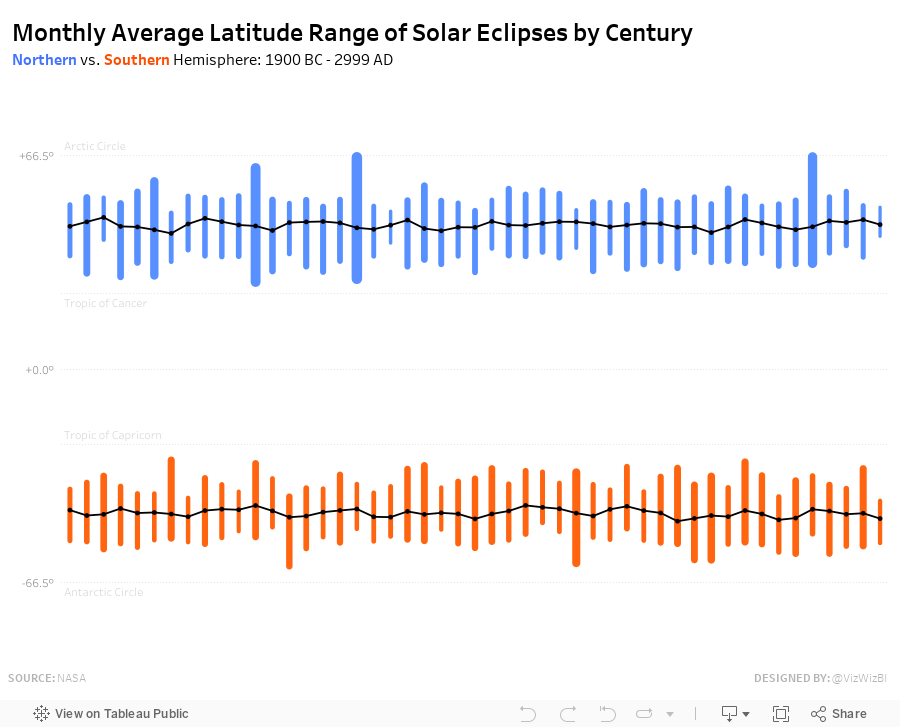
- Compare northern to southern hemisphere
- Use colors that are clearly distinguishable
November 8, 2011
Batch Geocoding: Convert addresses or locations into latitude-longitude coordinate pairs
I’ve been adding customers to the Penetration Reporting I presented at TCC11 (word is spreading and people love it!), but there are often records in our internal systems that do not match up with the master address list for our customers from Nielsen Spectra.
One of the great features of Tableau is data blending and this project is a perfect example of how you might use it. I have my sales and internal customer list in SQL server, but the location information, including latitude/longitude are in an Excel file. Tableau allows me to integrate these data sources via a key field, store number in this case.
As I referred to earlier, this works perfectly for ~95% of the records, but there are ALWAYS stores in our internal system that do not exist in Spectra. Here’s a sample of missing stores:

To prepare the data to address this problem I take the following steps:
- Concatenate the address fields together in Excel with the formula CONCATENATE(TRIM(Address)," ,",TRIM(City),",",TRIM(State)," ",TRIM(Zip))
- Copy all of the rows in the new “Full Address” column
Now the fun and magical part begins. A colleague led me to the tool Batch Geocoding, which basically takes text strings and returns the latitude/longitude coordinates. Here’s how it works:
- In the “Input” box, paste the data you copied from Excel above
- Choose your output format and click the “geocode” button
- Watch the magic as the tool populates the Output box.
- Copy all records from the Output box and paste into Notepad
- Save the Notepad file in txt format
- Open the TXT file in Excel
- Copy the records from the TXT file and append to the end of the master customer list from Spectra


That’s it! So simple! I have no idea how it works, but it does. Of course, it’s not going to be 100% accurate, because the addresses may not exist, but it does tell you how well it was able to match the records.

Definitely keep this link in your toolkit. I’ve also added a link on the right side of this blog under “Useful Data Sources”.






