August 21, 2017
Makeover Monday: The Monthly Latitude Range of Solar Eclipses by Century
This week we looked at this viz of thousands of years of solar eclipses:

What works well?
- Fantastic interactivity and drill down capabilities
- Showing the paths of each eclipse along with the partial eclipse breadth
- Coloring each eclipse type
- Leveraging Google Maps so the user can customize the map to their preference
- Good explanations above and below the chart
What could be improved?
- Remove the labels on each line to declutter the map
- Avoid a repeating map
- Include a more impactful title
My Goals
- Explore the data to find some interesting analysis per Eva's request
- Build lots of views to see what pops
- Simplify the view to reduce complexity and clutter
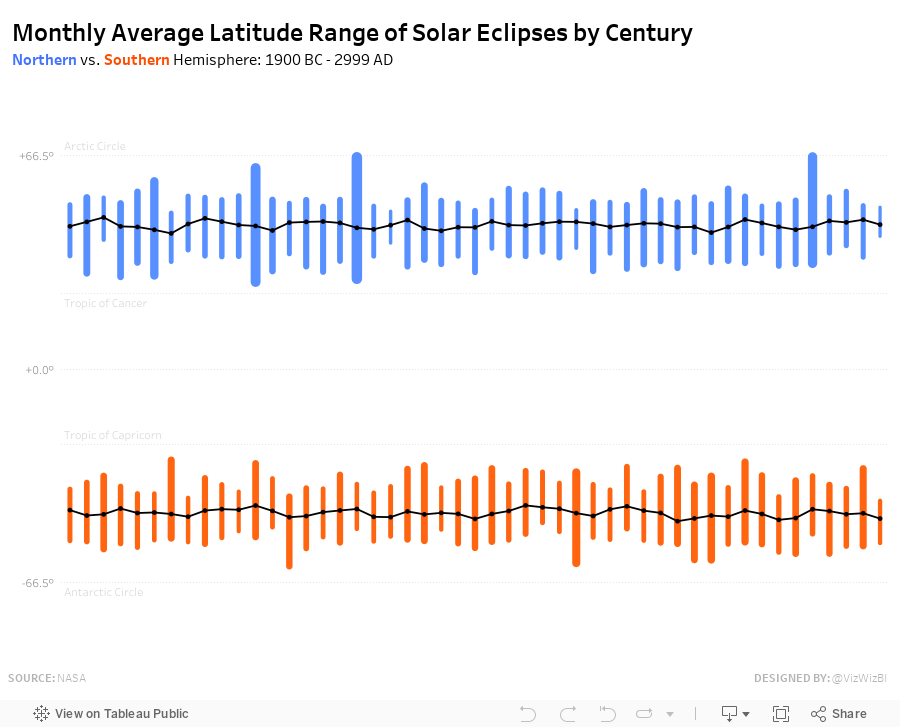
- Compare northern to southern hemisphere
- Use colors that are clearly distinguishable
As I mentioned, I really struggled. I built lots of view and probably hit undo 200 times. I didn't like anything. I sent a few complaining messages to Eva and she essentially told me to suck it up. Tough love indeed!
Finally, I decide to create a calculation to aggregate by century and then created an LOD to return the max and min latitude in any given month within the century. By any given month, I don't mean month/year, I mean month. So what is the average of all Januarys, Februarys, etc. and then what is the max of those values. I then compared that to max to the min to determine the range.
I don't love it, but I'm done. I've struggled enough.
Subscribe to:
Post Comments
(
Atom
)


No comments
Post a Comment