Showing posts with label rats. Show all posts
May 4, 2023
Tableau Techniques for Top Notch Spatial Analytics
airlines
,
analytics
,
distance
,
emoji
,
how to
,
lines
,
London
,
mapping
,
path
,
rats
,
routes
,
shape
,
shapefile
,
spatial
,
tableau
,
tug
,
video
No comments

Looking to level up your data visualization skills? Enjoy this live stream from the April 2023 Analytics Tableau User Group (TUG) where I dive deep into spatial data analysis in Tableau!
In this session, I will walk you through the process of importing and visualizing spatial data in Tableau. You'll learn how to use advanced mapping techniques to create powerful and visually stunning visualizations that tell compelling stories with your data.
I cover everything from basic mapping to advanced geospatial analysis, so whether you're a seasoned pro or just getting started with Tableau, you'll walk away with a wealth of knowledge and practical tips you can apply to your own data analysis projects.
Don't miss this opportunity to learn from me and take your data visualization skills to the next level. Watch now and start unlocking the power of spatial data analysis in Tableau!
Download the workbook and data sources to follow along.
MEMBERSHIP PROGRAM
Join my exclusive membership program for data analytics and visualization professionals. The membership program provides unparalleled access to tutorials and templates, curated content, an online community, webinars, expert guest speakers and live training with me.
My program is the best platform to learn, grow, unlock your potential, and succeed in your career.
Sign up or express your interest @ andykriebel.com
October 20, 2020
#TableauTipTuesday: Four Methods for Creating Dots on a Map
circles
,
density
,
dots
,
fundamentals
,
generalize
,
hex map
,
hexbin
,
latitude
,
location
,
longitude
,
map
,
mapping
,
new york
,
rats
,
round
,
tableau
,
tip
,
trick
,
tutorial
No comments

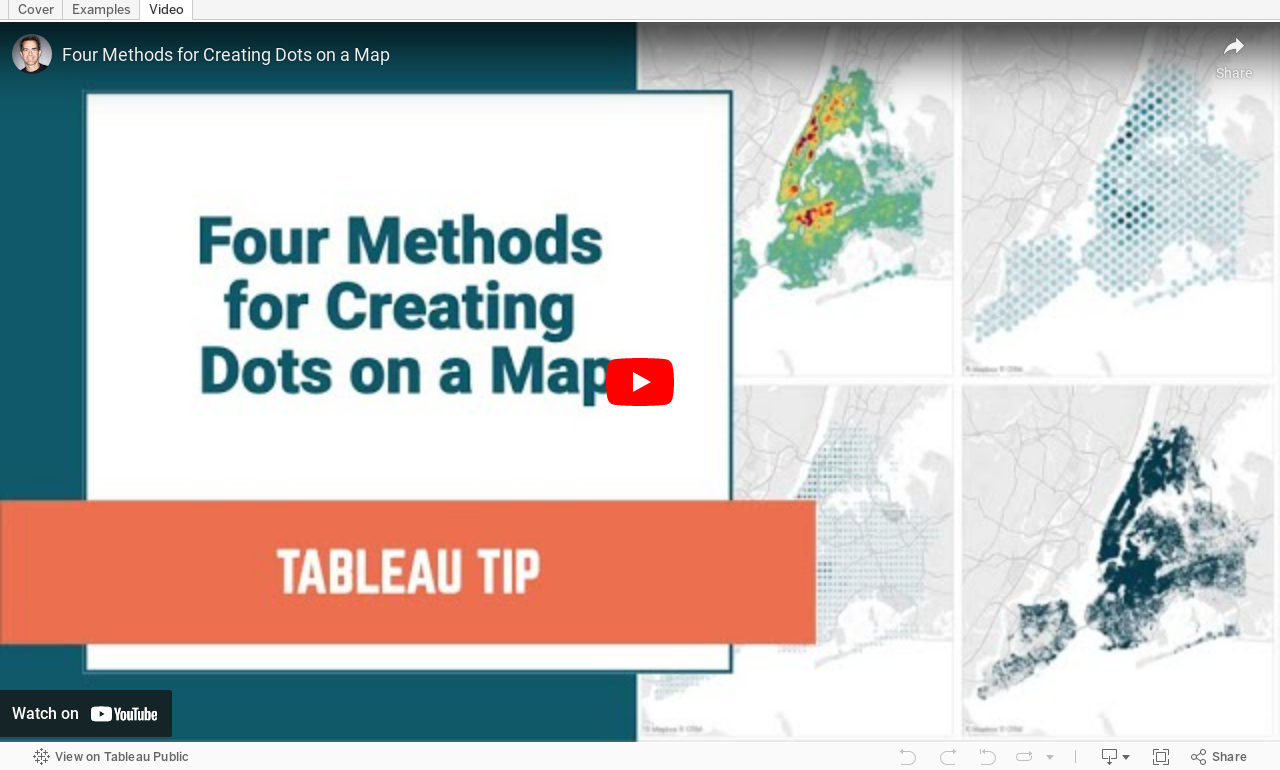
People love maps. Putting dots on a map gives a sense of precision. There are lots of methods for displaying maps. In this video, I show you four:
- The exact locations
- Density map
- Using the ROUND function to generalize the points
- Using the HEXBIN functions to generalize the points, but at a level controllable by the user
November 4, 2019
How Many Rats Are Near Hungry Cat?
action
,
distance
,
new york city
,
open data
,
rats
,
spatial
,
Workout Wednesday
No comments

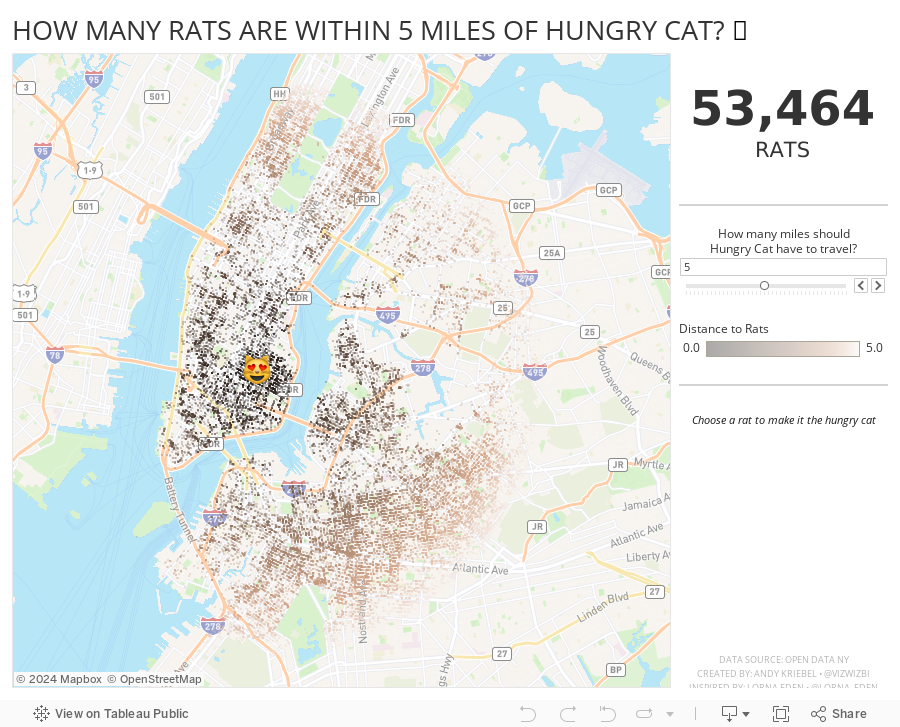
And right after I taught this class to DS16, Lorna Eden posted the Workout Wednesday week 43 challenge. In this challenge, you had to find all casinos within X miles of a casino you click on. This required using the new DISTANCE function that came into Tableau 2019.3.1.
So, why not practice this technique more, but with rats? Instead of clicking on a casino, you can click on a rat to make it the Hungry Cat and find all rats within X miles of the cat. Silly, yes, and fun to practice too. The rats all have names too.
Lastly, I wanted to resize the dots based on the number of rats in the view. I used this blog post from The Data School, except I used an LOD instead of a table calc.
Enjoy! Find the rats near you.
July 1, 2018
Makeover Monday: Where are New York's rats?
Alteryx
,
boroughs
,
frequency
,
heat map
,
Jowanza Joseph
,
line chart
,
Makeover Monday
,
new york city
,
open data
,
rats
,
tableau
,
tile grid map
No comments

The original article by Jowanza Joseph contains several fantastic visualization, most which look like they were created in R. For this week's makeover, we need to try to make this visualization better:

What works well?
- Simple title that tells us what the data is about and the time period
- Axes are clearly labeled
- Including light gridlines for context that aren't distracting
- Including every sighting as a dot for context; it's interesting how these show cyclical patterns
- Including an average line which confidence bands to show the overall pattern
- Excellent color choices; the purple really works well again the grey background
What could be improved?
- Include an explanation of what the line represents
- Include the data source and author's name
- Remove the word "Date" from the x-axis. That's implied by the title and the year labels.
What I did
- We were doing Alteryx spatial training this week at The Data School this week, so I wanted to do something using the locations of the rats, but not a simple dot of where each sighting occurred.
- I wanted to use Alteryx as I'm working to improve my skills in that area.
- I create a tile grid map using Alteryx for London crimes last year and wanted to do that again, as I need to practice techniques several times to reinforce them.
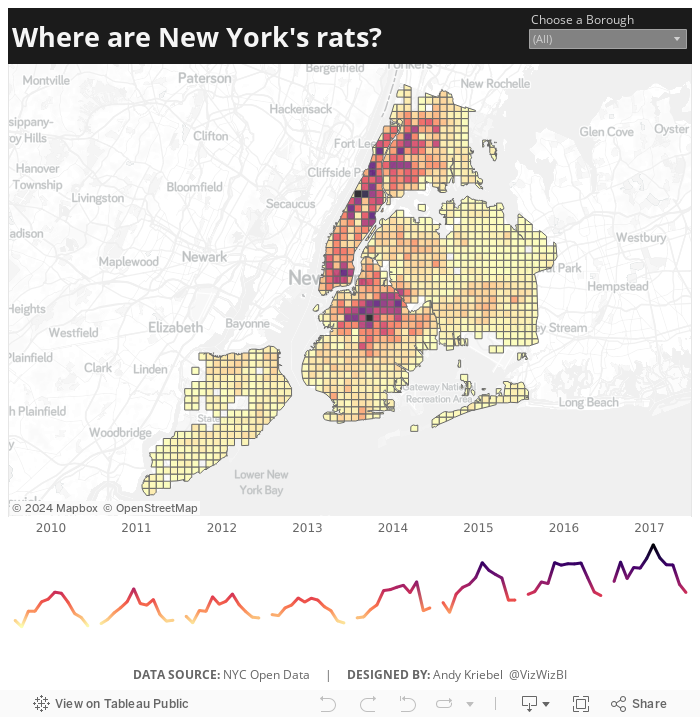
- Create the tile grid map so every 1/2 mile and have them cut off at a Borough's edge
- Create a simple, minimalist map and line chart in Tableau
- Use the Magma color palette as I really like how it works as a heat map
Alteryx Workflow

The workflow is pretty simple. It takes the individual sightings, converts them to spatial points, assigns them to a 1/2 mile grid based on shape files available for each borough, then I export it as a shape file.
Tableau Visualization
In Tableau, it's simply a matter of double clicking on the spatial object, adding the borough and grid ID to give it the right level of detail, adding color by number of sightings, creating a line chart, adding a borough filter, and cleaning up the tooltips.
Because all of the heavy work was done in Alteryx, it takes about 10 minutes to create the visualization in Tableau, most of that time being formatting. With that, here's my Makeover Monday week 27 about rat sightings in New York City.
Subscribe to:
Posts
(
Atom
)






