Showing posts with label emoji. Show all posts
May 4, 2023
Tableau Techniques for Top Notch Spatial Analytics
airlines
,
analytics
,
distance
,
emoji
,
how to
,
lines
,
London
,
mapping
,
path
,
rats
,
routes
,
shape
,
shapefile
,
spatial
,
tableau
,
tug
,
video
No comments

Looking to level up your data visualization skills? Enjoy this live stream from the April 2023 Analytics Tableau User Group (TUG) where I dive deep into spatial data analysis in Tableau!
In this session, I will walk you through the process of importing and visualizing spatial data in Tableau. You'll learn how to use advanced mapping techniques to create powerful and visually stunning visualizations that tell compelling stories with your data.
I cover everything from basic mapping to advanced geospatial analysis, so whether you're a seasoned pro or just getting started with Tableau, you'll walk away with a wealth of knowledge and practical tips you can apply to your own data analysis projects.
Don't miss this opportunity to learn from me and take your data visualization skills to the next level. Watch now and start unlocking the power of spatial data analysis in Tableau!
Download the workbook and data sources to follow along.
MEMBERSHIP PROGRAM
Join my exclusive membership program for data analytics and visualization professionals. The membership program provides unparalleled access to tutorials and templates, curated content, an online community, webinars, expert guest speakers and live training with me.
My program is the best platform to learn, grow, unlock your potential, and succeed in your career.
Sign up or express your interest @ andykriebel.com
July 2, 2019
#TableauTipTuesday: Fun with Maps
density
,
dots
,
emoji
,
hexbin
,
maps
,
round
,
Tableau Tip Tuesday
No comments

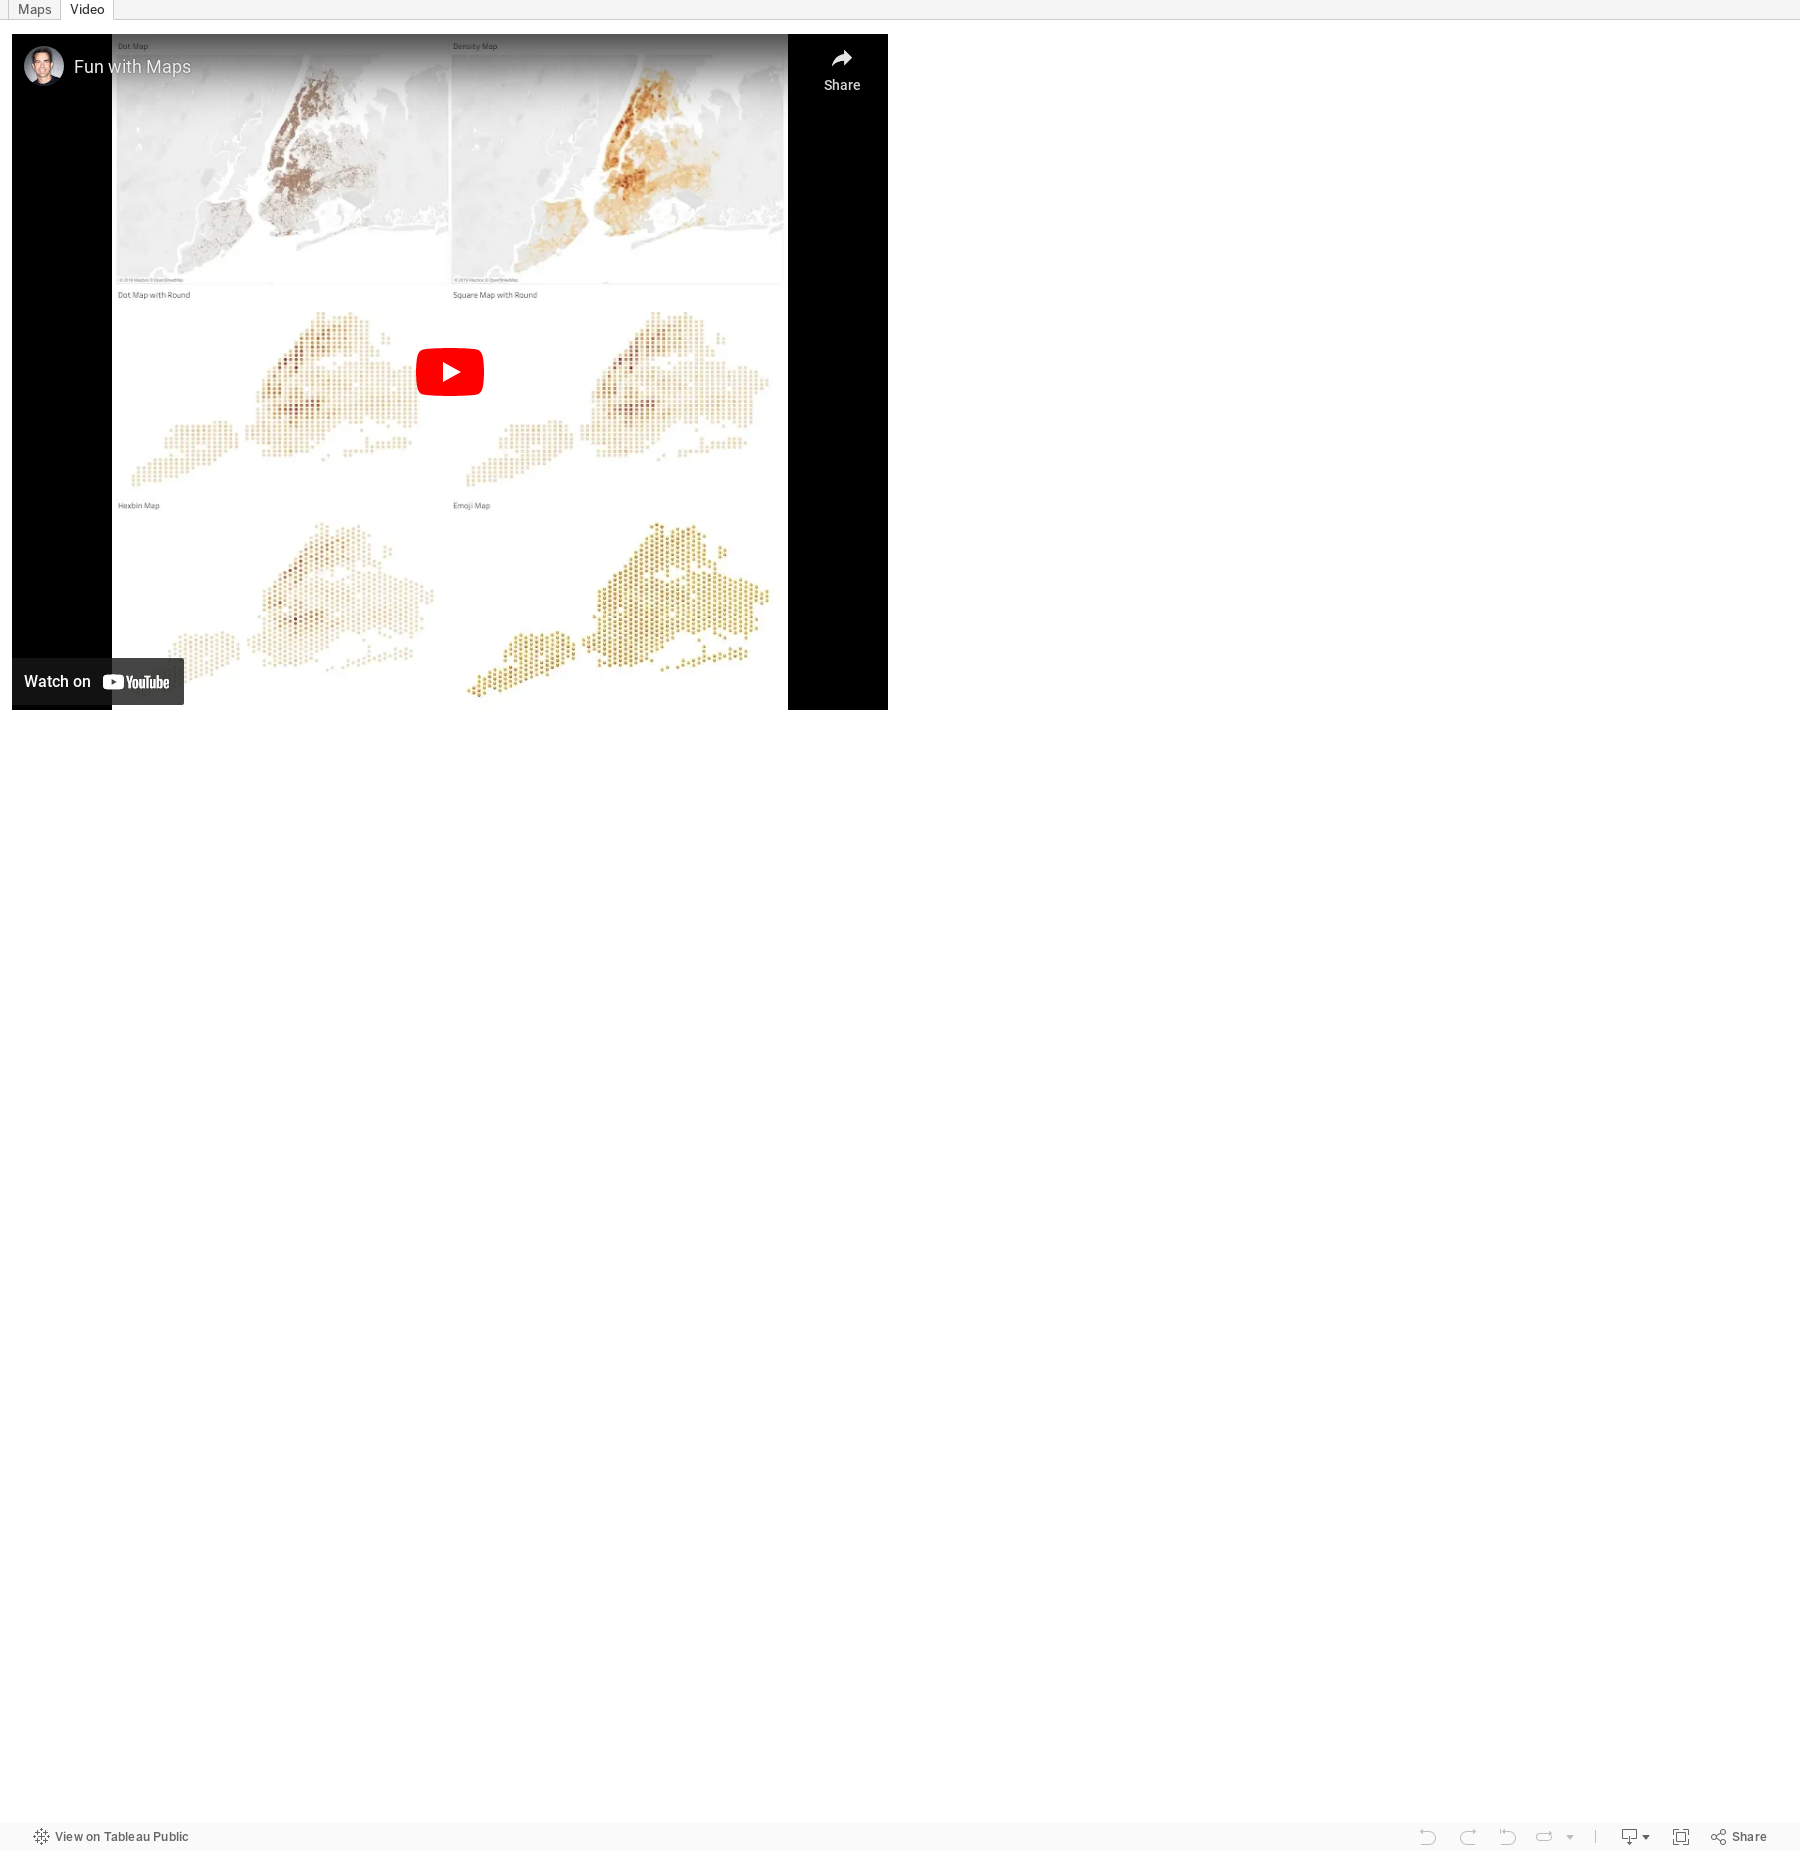
April 12, 2018
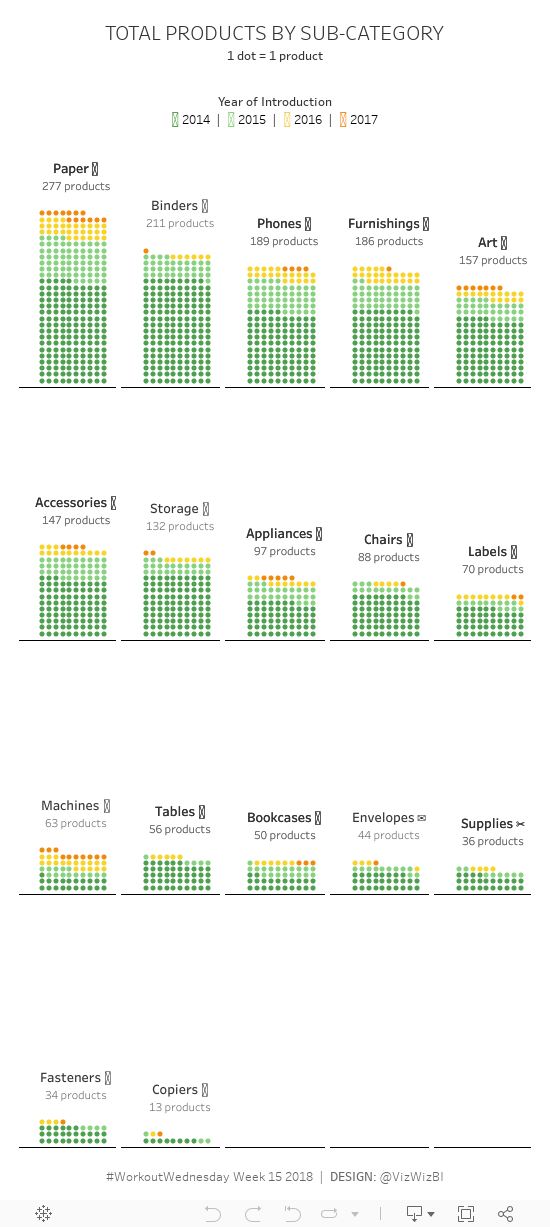
Workout Wednesday Part 2: Total Products by Sub-Category
Ok, part 2 of this week's challenge, the Jedi version, really sucked (requirements here). It took me FOREVER! I used table calcs for all of the calculations and getting them just right took a really long time and a lot of experimenting. Surely Tableau can make this easier for us.
Some thoughts:

Some thoughts:
- Getting the subcategories to layout correctly in a trellis plot was easy.
- Getting the labels above each grid was easy.
- Getting 10 dots across each pane was easy.
- Getting the stacking of the dots in rows was a pain!
- Luke has an evil side.
But I absolutely loved the challenge. I'm really enjoying these! My advice for everyone is to keep at it until you get it. Even if you're stuck, don't cheat and download the solution. That doesn't help your learning. If it's too hard, then consider skipping it; it might not be the right level for you yet. You can always come back and do it later.
February 3, 2016
Dear Data Two | Week 42: Laughing

For my analysis, I only considered laughing that occurred at the Data School, which means data is only through Thursday as we had a company trip the rest of the week.
I collected a few characteristics about each laugh:
- When
- Who was I with
- What was I laughing about
- How big was the laugh
From there, I started my analysis, focusing mainly on Lorna's accusations that I pick on her too much. What you'll find in the analysis below is that it looks like I laughed AT Lorna way more than I laughed WITH her. However, once I created the postcard and included what we were laughing about, it's evident that I was often laughing at someone else, not her.
In the end, I wanted the postcard to look like an emoji, so I built an emoji view of all of the laughs in Tableau first before creating the postcard. What I like about the postcard is that I gave me the opportunity to incorporate more information and more detail into the final product.
Overall, a very fun week!

Subscribe to:
Comments
(
Atom
)


