December 17, 2024

Learn how to build a stunning waffle chart in Tableau using map layers and calculations!
This advanced Tableau tutorial will show you how to simplify the creation of waffle charts while unlocking powerful design and flexibility for your data analysis projects.
You’ll Learn How To:
- Connect Tableau to Superstore and a waffle chart template with Relationships
- Use the MakePoint function to create dynamic map-based charts
- Apply map layers for advanced customization and perfect label placement
Why You Need This:
This method combines advanced Tableau charts with the flexibility of map layers, allowing you to:
1. Create precise grid-based waffle charts.
2. Perfectly center labels without complex workarounds.
Who Is This For?
- Data analysts looking to enhance their Tableau dashboards
- Advanced Tableau users exploring new chart techniques
Become a Next-Level Tableau member and become a Tableau expert

September 10, 2019
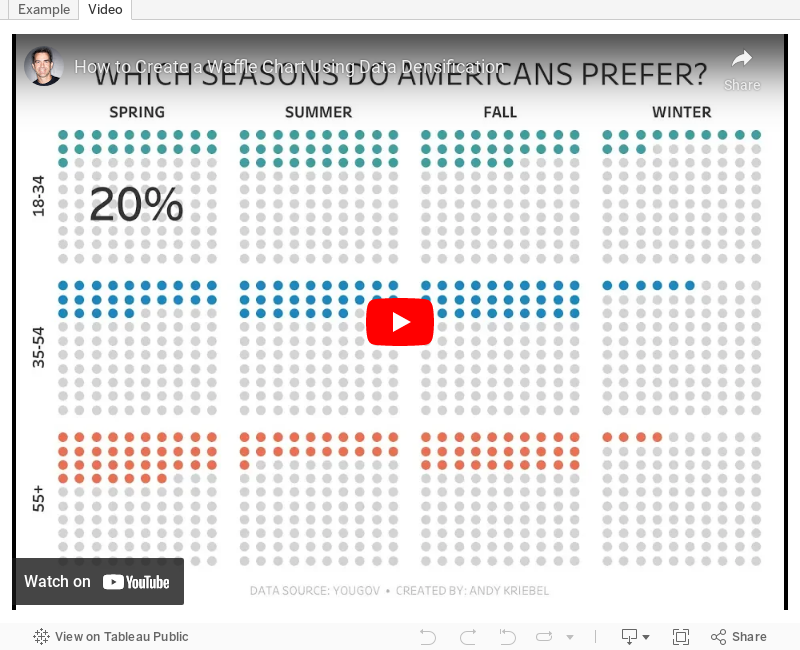
#TableauTipTuesday: How to Create a Waffle Chart Using Data Densification

August 6, 2018
Makeover Monday: America's Contribution to Worldwide Research & Development Steadily Declined From 2011 to 2015


What works well?
- The title is clear, making the topic easily known.
- The big numbers work well for the larger circles.
- It's an innovative design, but that doesn't mean it effective.
- Citing the sources
What could be improved?
- Pretty much everything
- The sequence is too hard to understand.
- The color legend is sorted descending.
- The colors on the ends are too similar.
- There's way too much text, making it all feel very squished.
- The color ranges aren't of equivalent size.
- The maps of each country inside the circles don't add any value.
- It would take forever to find out where a country ranked.
My Goals
- Throw away everything they did and start over.
- I really liked the simplicity of Eva's viz, so I went with her idea of focusing on just the US.
- I wanted to understand how the contribution the US has made has changed over time.
- Use the official Makeover Monday color palette
March 14, 2018
Workout Wednesday: Candy Button Small Multiples
One thing he mentioned in the blog is that now you can use unicode characters in 10.5, however, I've been using them for a long time. I got to this site, find the character I want to use, and paste it into the calculation or field name.
The trickiest part for me on this challenge was getting the dots in the right place, that is, starting at the bottom right. I had to swap some of the logic of the calcs around and it was done. As for the headers above each set of dots, well, I'll leave that to you to figure out. Here's my tip: don't overcomplicate it; it's quite simple.
Again, find all of Rody's requirements here. Click the image below for the interactive version.
November 27, 2017
Makeover Monday: Two Simple Ways to Improve the World
To celebrate week 100, Eva and I will be hosting a webinar next Monday and we'll be joined by Andy Cotgreave (yes I know it's week 101). Register here. In this webinar we'll reflect on the first 100 weeks and answer any questions you have. It's going to be fun!
In addition, we have two more webinars coming up this week. You can find all of our webinars here.
- Wednesday, Nov 29 @ 6pm GMT - Week 48 Viz Review
- Thursday, Nov 30 @ 4pm GMT - All I want for Christmas is Maps (with Mapbox)

What works well?
- It's quite attention grabbing due to the overall design and color.
- The big text in the middle catches your eye.
- Every section is clearly labeled.
- Underlining each slice with the color it represents.
What could be improved?
- There's no overall structure or order.
- At first glance it looks like a donut chart, but each section adds up to 100 by itself.
- The grey background behind each section label is unnecessary.
- Within each section, the segments should be ordered by size.
September 13, 2017
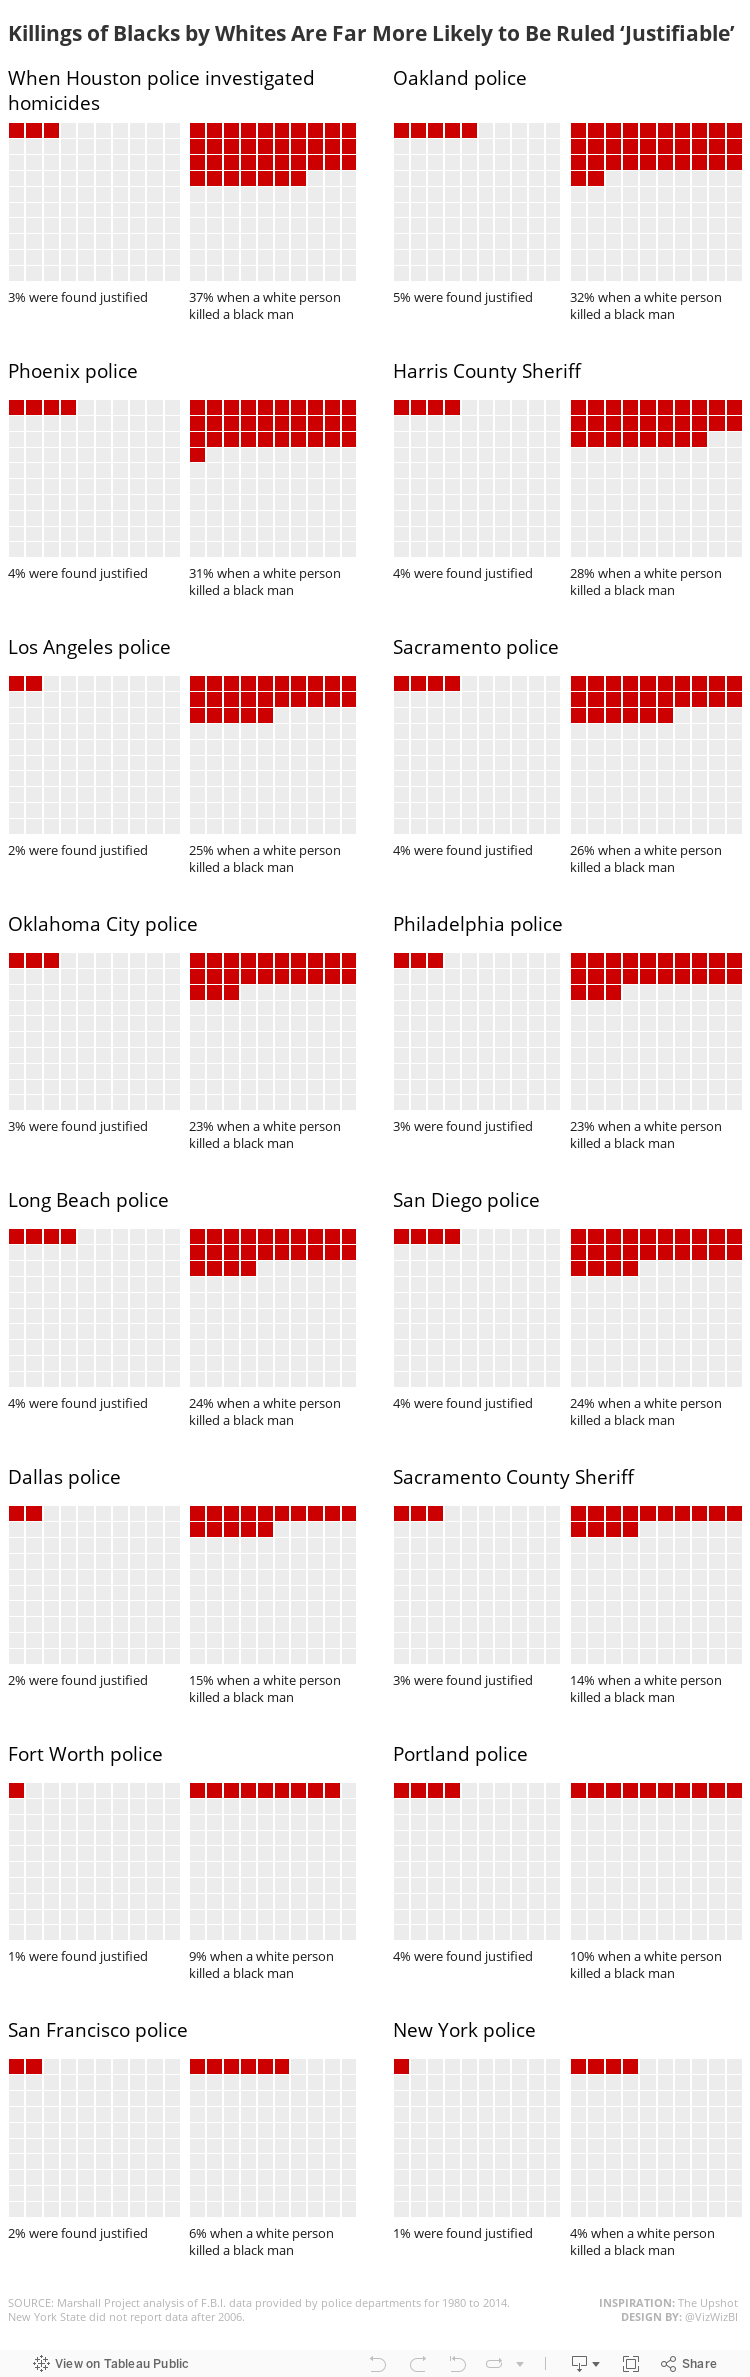
Workout Wednesday: Killings of Blacks by Whites Are Far More Likely to Be Ruled 'Justifiable'
Requirements:
- Dashboard size is 750x2350.
- Make sure you credit the data source and credit The Upshot for inspiration as I have.
- Match my title.
- For each city, there should be two waffle charts. The first should show the overall percentage of justified killings. The second waffle chart should show the percentage justified when a white person killed a black.
- Match the text under each waffle chart. Note that the text must be in the same worksheet and the percentage displayed must be based on a calculation.
- The text above each pair of charts should span across the two waffle charts for that city.
- There should be a 20 pixel buffer between each row of charts.
- There should be a 20 pixel buffer between cities that are on the same row.
- Use hex code #CC0000 to represent the percentage justified and use #ECECEC to represent the unjustified killings.
- Match the layout exactly for the text boxes.
- Match the tooltips.
- Everything MUST be tiled; no floating elements allowed.
- I used the Benton Sans font, but that won't render on Tableau Public, so use whatever font you wish. Benton Sans helped me get the word wrapping and spacing just like The Upshot had it.
Data sources:
August 23, 2017
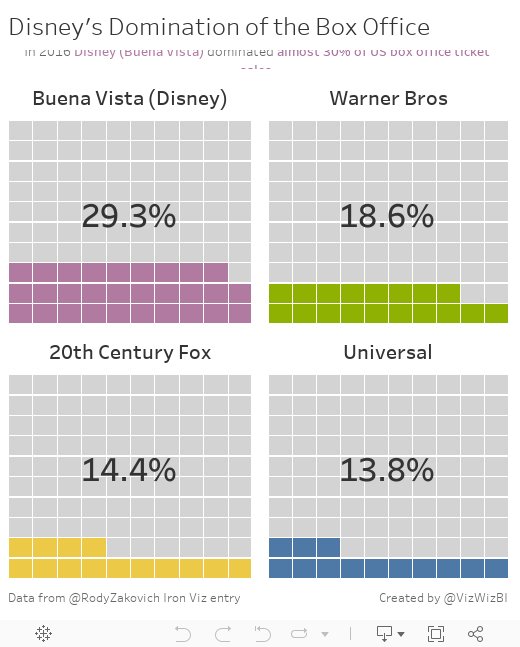
Workout Wednesday: The Waffles of Disney's Domination
The waffle chart bit was pretty straight forward. The trickiest part for me was the calculation to get the % of total.
Fun one! Give it a go!
March 27, 2017
Makeover Monday: The Secret of Success

Andy Cotgreave messaged Eva and me about this particular viz and found a great article that does an excellent in-depth review of this particular piece. Reading the article helped reassure the thoughts that I've had about this chart over the years.
What works well?
- Engaging design
- Clear labels on the values
- Legend matches the shape of each amoeba
- Everything is scaled in proportion
- Good color choices
- Nice big title
- The subtitle is very offensive. It sure seems this survey was conducted by some extreme right-wing group.
- The overlapping colors make it hard to follow the pattern.
- Radar charts are very hard for making comparisons across categories.
- The radars are curved to make the segments appear to take up more space.
- Unnecessary icons
January 17, 2017
Tableau Tip Tuesday: How to Create Waffle Charts

I love waffles! So why not learn how to make waffle charts? This week, I show you a very simple way to create them. Inspiration for this post came from this post by Russell Christopher. The difference between his post and mine is that I don’t require any table calculations; that’s nearly always a win for me!
I created a template for the grid layout (the primary data source that I use in the video), which you can find here. I’d love to see more examples that you build with this. Good luck!


