August 8, 2023
How to Master the 3-Level Drill Down in Tableau (with Dynamic Zone Visibility)

Welcome to my guide on mastering the 3-Level Drill Down in Tableau!
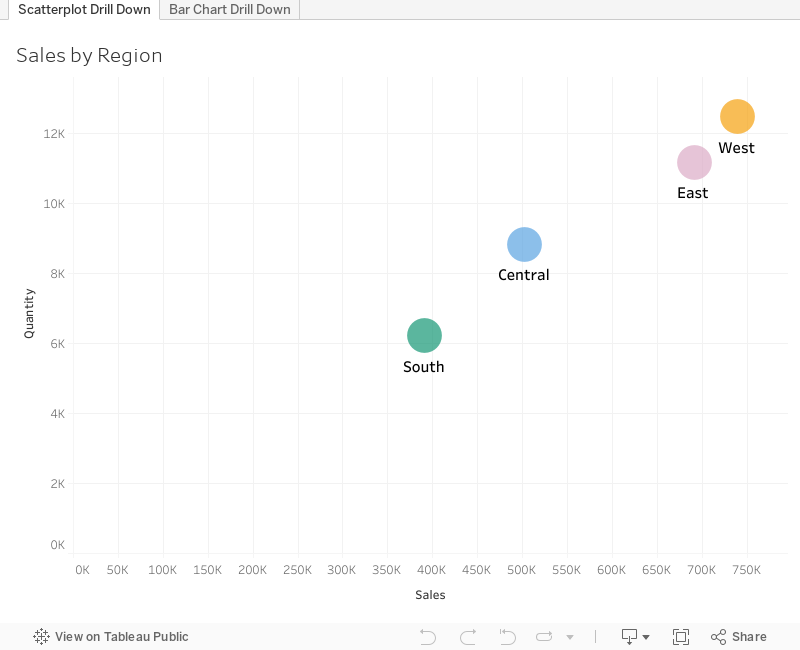
In this tutorial, I show you step-by-step how to make the most of using dynamic zone visibility to create this functionality. We'll go through both scatter plot drill downs from Region → State → Postal code and then replicate that as a bar chart.
You can easily make this a map drill down by changing the chart type. That's it!
🔍 What you'll learn in this video:
1. The basics of drill down functionality in Tableau
2. Hands-on demonstrations, tips, and best practices
3. How to interact with the data
💡 Why is this important?
Drill down capabilities allow analysts to explore data from a broad overview down to granular details. By mastering the 3-level drill down, you can uncover hidden patterns, insights, and trends that might be overlooked in higher-level analyses.
📌 Prerequisites:
A basic understanding of Tableau's interface and primary functions will be helpful, but beginners will be able to follow along as well!
If you are following along, be sure to pause the video along the way as you repeat the steps.


No comments
Post a Comment