August 8, 2023
How to Master the 3-Level Drill Down in Tableau (with Dynamic Zone Visibility)

Welcome to my guide on mastering the 3-Level Drill Down in Tableau!
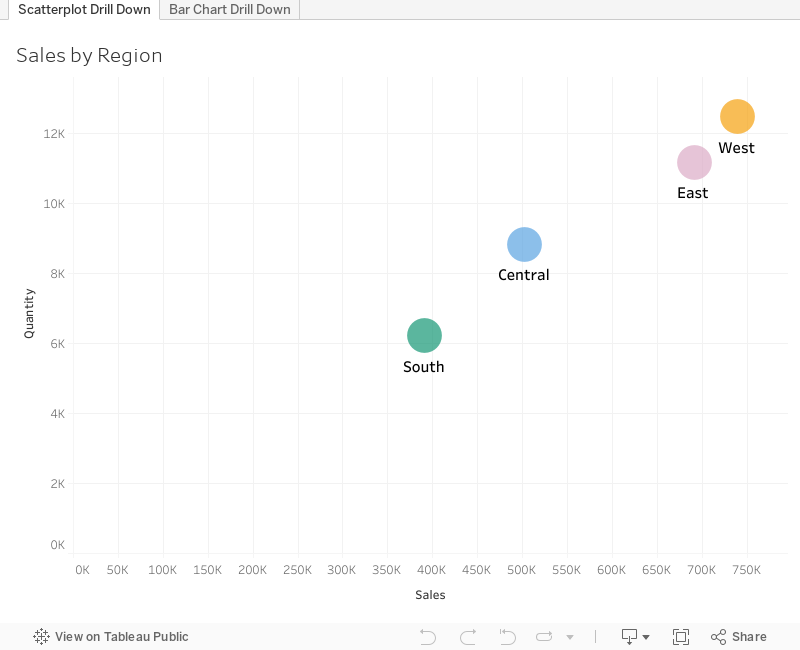
In this tutorial, I show you step-by-step how to make the most of using dynamic zone visibility to create this functionality. We'll go through both scatter plot drill downs from Region → State → Postal code and then replicate that as a bar chart.
You can easily make this a map drill down by changing the chart type. That's it!
🔍 What you'll learn in this video:
1. The basics of drill down functionality in Tableau
2. Hands-on demonstrations, tips, and best practices
3. How to interact with the data
💡 Why is this important?
Drill down capabilities allow analysts to explore data from a broad overview down to granular details. By mastering the 3-level drill down, you can uncover hidden patterns, insights, and trends that might be overlooked in higher-level analyses.
📌 Prerequisites:
A basic understanding of Tableau's interface and primary functions will be helpful, but beginners will be able to follow along as well!
If you are following along, be sure to pause the video along the way as you repeat the steps.
October 28, 2020
How to Create a Venn Diagram

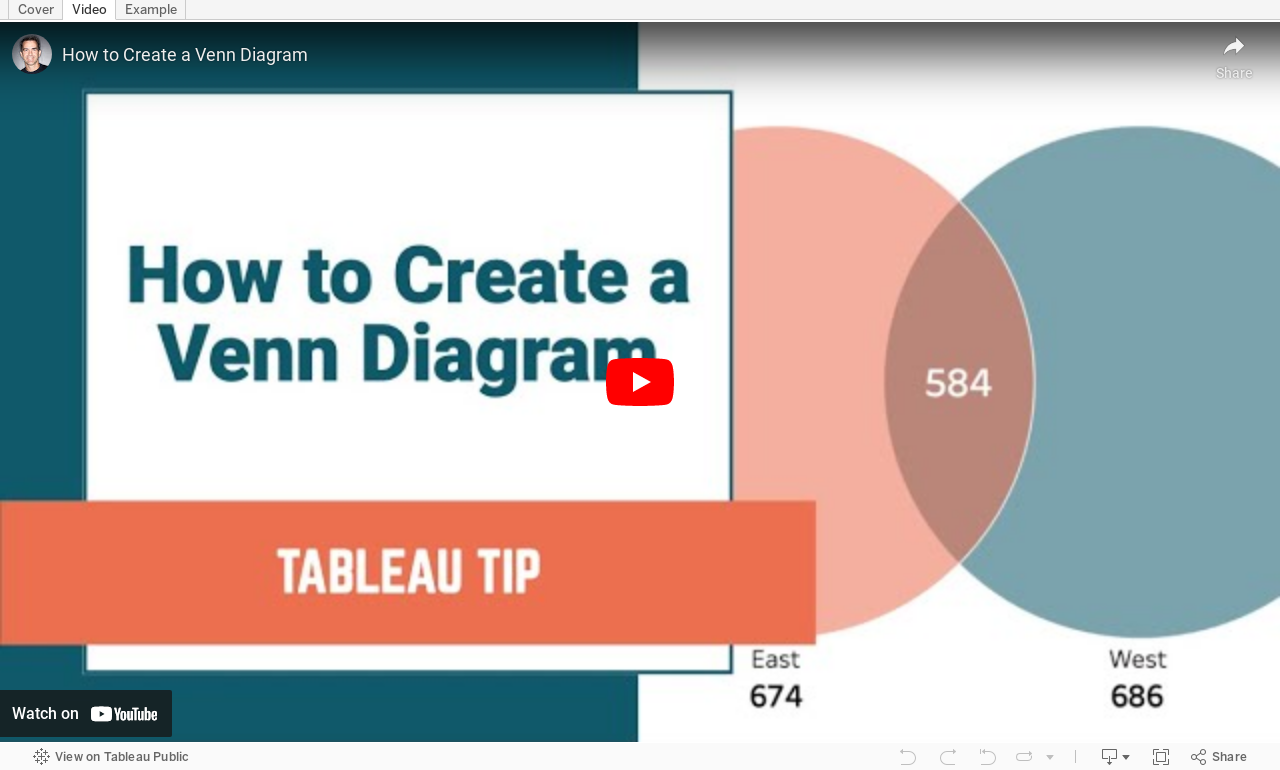
Venn diagrams (also called Set diagrams or Logic diagrams) use overlapping circles to illustrate the logical relationships between two or more sets of items. They depict how things relate to each other within a particular segment.
For example, how many customers made purchases in the East region, in the West region, and in both regions?
Where the circles overlap, you display text or a value the represents the value associated with the relationship.
I created a Venn diagram for my Visual Vocabulary and while teaching how to create it, I thought of a much simpler way to create them. All of the versions you see online (and the version in the Visual Vocabulary) require you to:
- Create sets
- Evaluate how many things are in each set as an aggregate
- Align the circles according to these values
- Create a calc to display the text for the overlap with a computed set
October 26, 2020
#MakeoverMonday 2020 Week 43 - #WatchMeViz - Apparel Exports to the U.S.
For #MakeoverMonday week 43 we analyzed data about apparel exports to the US during the Coronavirus pandemic. In this session of #WatchMeViz, I showed 28 different ways to visualize time series data (there are way more) before we all settled on a viz that's basically the same as the original and looks nicer.
Subscribe to my YouTube channel here to get all of my latest Tableau Tips and notifications for upcoming live streams.
Show Notes / References:
- Data Set - https://data.world/makeovermonday/2020w43-apparel-exports-to-us
- Tableau Reference Guide (incredible repository of thousands of Tableau tips) by Jeffrey Shaffer - http://www.tableaureferenceguide.com/
- How to Shade Between Two Lines with Polygons by Rody Zakovich - http://www.datatableauandme.com/2017/08/how-to-shade-between-2-lines-in-tableau.html
- Title Capitalization - https://capitalizemytitle.com/

September 9, 2020
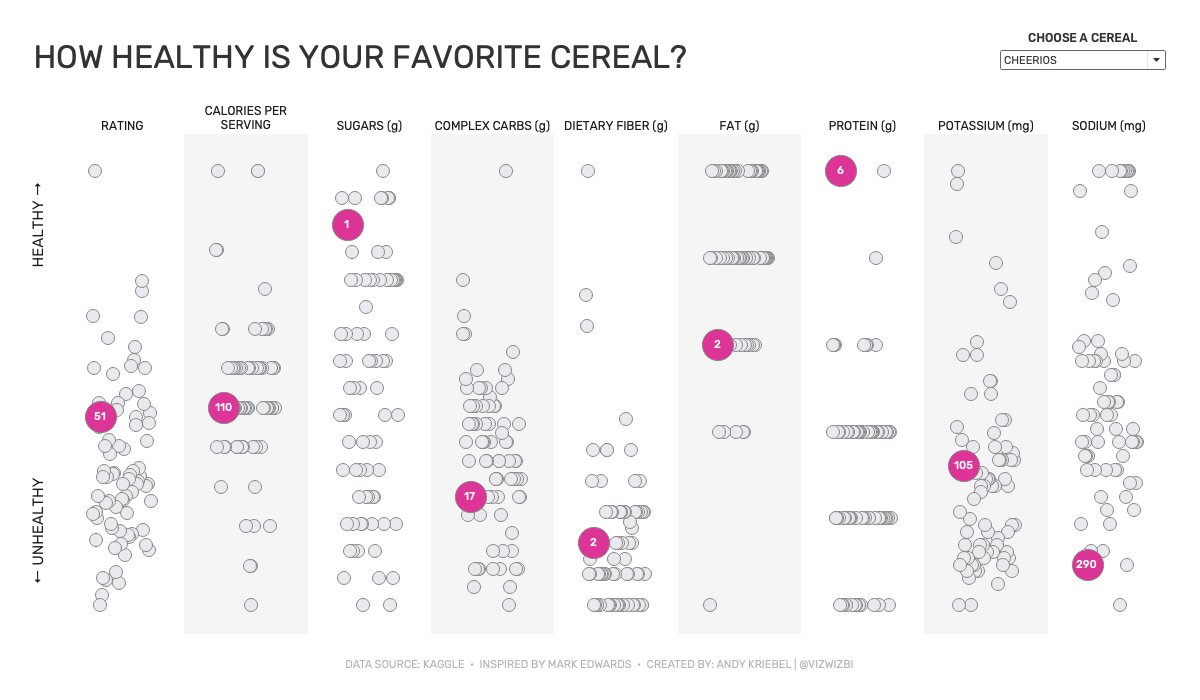
Watch Me Viz - #MakeoverMonday 2020 Week 36 - How Healthy Is Your Favorite Cereal?