October 28, 2020
How to Create a Venn Diagram
beginner
,
calculated field
,
circles
,
color
,
computed set
,
demo
,
how to
,
label
,
level of detail
,
LOD
,
logic diagram
,
overlap
,
set
,
set diagram
,
size
,
tableau
,
text
,
tip
,
venn diagram
No comments

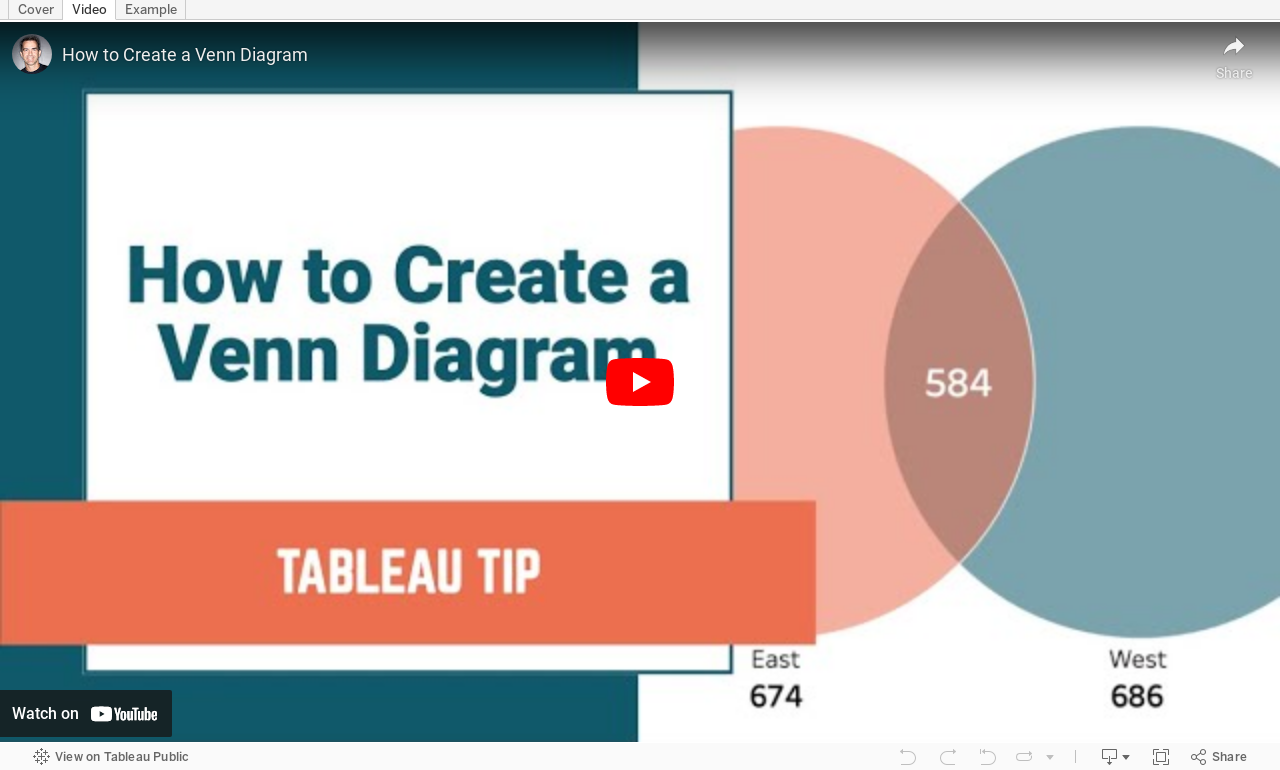
Venn diagrams (also called Set diagrams or Logic diagrams) use overlapping circles to illustrate the logical relationships between two or more sets of items. They depict how things relate to each other within a particular segment.
For example, how many customers made purchases in the East region, in the West region, and in both regions?
Where the circles overlap, you display text or a value the represents the value associated with the relationship.
I created a Venn diagram for my Visual Vocabulary and while teaching how to create it, I thought of a much simpler way to create them. All of the versions you see online (and the version in the Visual Vocabulary) require you to:
- Create sets
- Evaluate how many things are in each set as an aggregate
- Align the circles according to these values
- Create a calc to display the text for the overlap with a computed set
In this video, I show you how to create a Venn diagram with one simple calculation for the placement of the circles (a continuous dimension), a dummy field for the middle text, and one LOD to count the things that overlap.
No sets required! It's super simple, I promise! I also show you why the LOD calculation works that counts the things in the overlap.
Enjoy!
Subscribe to:
Post Comments
(
Atom
)


No comments
Post a Comment