May 3, 2017
What did it take to get to the Madrid Marathon?
Alteryx
,
Information Lab
,
Madrid Marathon
,
map
,
routes
,
RunKeeper
,
running
,
statistics
,
strava
,
tableau
,
TomTom
,
web data connector
No comments
My TomTom watch syncs to both Runkeeper and Strava, both of which I used to visualize my 16 week training program.
The routes for each run are in the form of GPX files, with a data point for every second of the run. I created this Alteryx workflow to parse those files and create the routes I needed to visualize in Tableau.
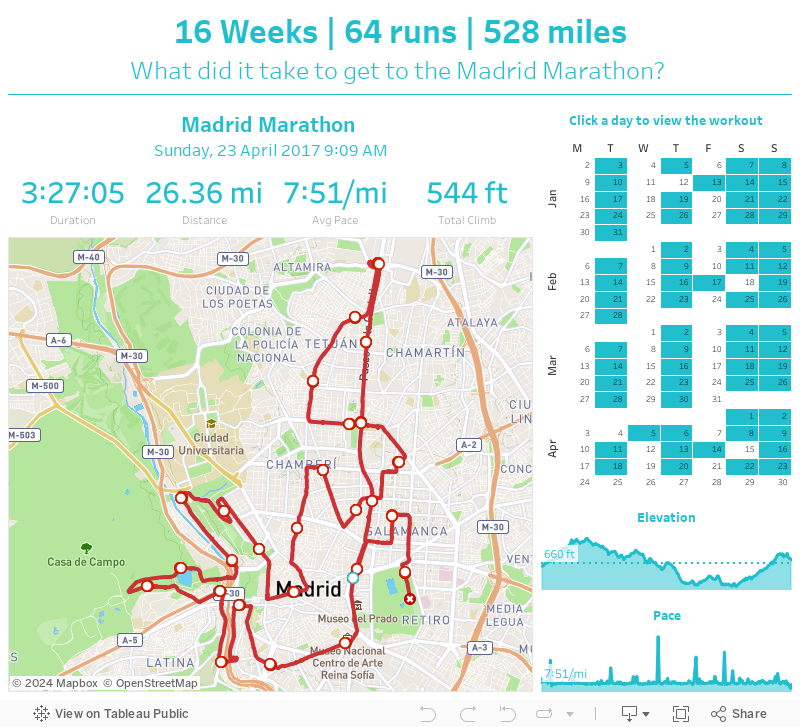
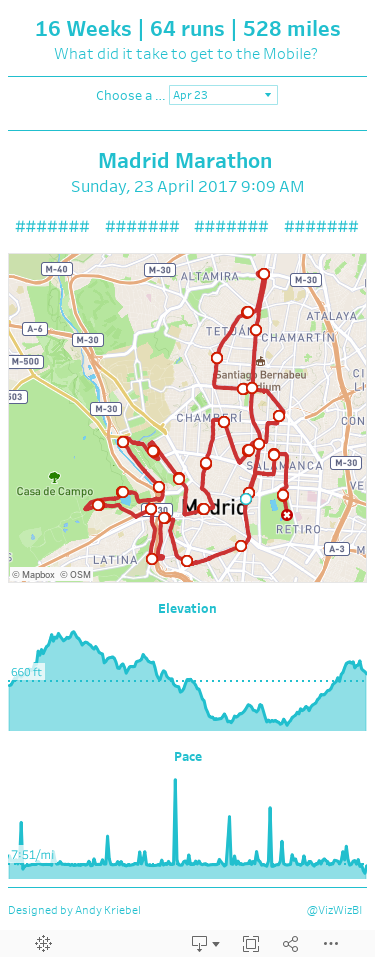
When designing the dashboard, I wanted the focus to be on the map, so I allocated the most space for that. I used the Mapbox Outdoor theme map because it's very similar to what Runkeeper uses. I made the lines red so that they stand out against the map and then added indicators for the start, end, and each mile.
Above the map, I wanted to display the stats for each run (from Strava). I added a calendar on the right to show the frequency of my runs (I must admit I'm pretty consistent). The user can click on a date to see the details and map for that run.
Lastly, I added elevation and pace charts. I'm not all that pleased with how these turned out, but it'll have to do.
So that's about it. 16 Weeks | 64 runs | 528 miles - that's what it took to get to the Madrid Marathon.
Subscribe to:
Post Comments
(
Atom
)


No comments
Post a Comment