May 23, 2017
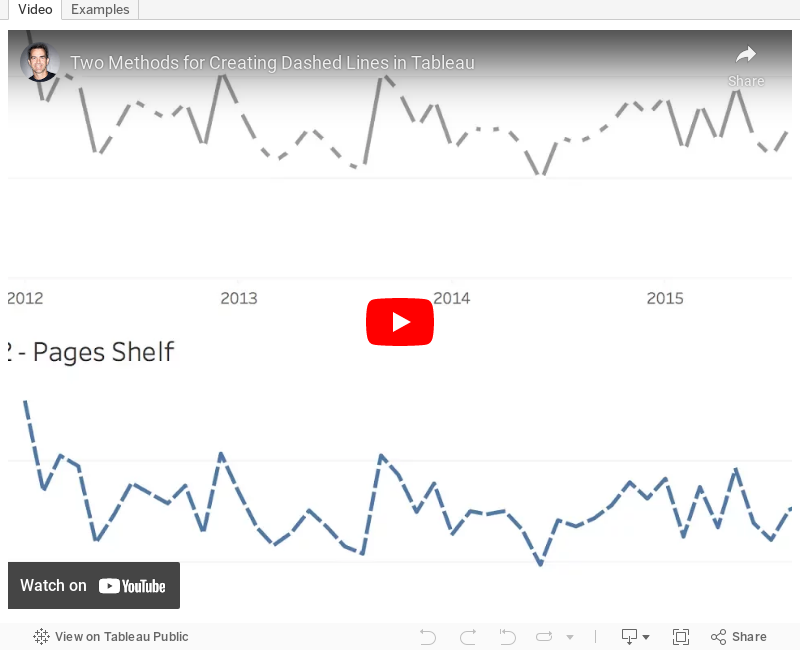
Tableau Tip Tuesday: Two Methods for Creating Dashed Lines
Subscribe to:
Post Comments
(
Atom
)

© VizWiz 2009. Powered by Blogger . Blogger templates . Social Networking Scripts . Posts RSS . Comments RSS
Thanks Andy.It's awesome:)
ReplyDeleteTwo really nice tricks - thanks for taking the time to share them. I really like the table calc version for when you have a controlled viz which is published to server and so can't be knackered by drilling into Dimensions.
ReplyDeleteThanks Charlie. After talking to Eva, she just colored each year but my solution would be work as data gets added.
DeleteCan i do this without dual axis? I have 8 measures,out of which 4 have to made dashed lines. help would be appreciated ...Thanks.
ReplyDeleteWhy do you need dashed lines in the first place? They are generally not best practice.
DeleteTo differetiate ,as they belong to different groups(client requirement). Or is there anyway i can change the data point markers(different shapes as line markers for each groups)?
DeleteYes, that's what the shape shelf is for.
DeleteThanks Andy. Will try making use of shapes instead of dashed lines.
DeleteThe calculation offered in the video is rad. Here's how we can optimize it.
ReplyDeleteif first()=0 then 1 //first
elseif last()=0 then 2 //last
else 0 //others
end