February 1, 2017
Workout Wednesday: The Distribution and Median of NFL Quarterbacks
distribution
,
LOD calc
,
mean
,
nfl
,
percentiles
,
quarterback
,
Workout Wednesday
1 comment
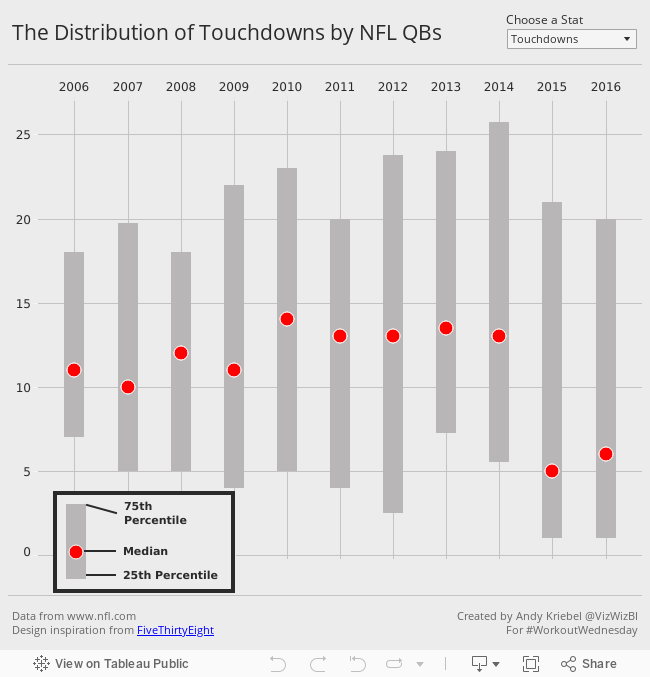
Last week on my Data Viz Done Right site, I wrote about a distribution visualisation created by Harry Enten that shows the range of dates for snowfall at select U.S. cities. It's Super Bowl week, so I decided to recreated the style of Harry's viz in Tableau with the same NFL data that Emma used last week. Your challenge this week is to re-create my viz.Below is the visualisation that I created. If you're reading this on a phone, tap on the image for the interactive version. Some requirements to keep in mind that are intentionally designed to make this tougher and to make you learn:
- All of the elements must be floating on a dashboard sized 650x650.
- You cannot use the Player dimension anywhere in the view.
- Match my colors including the background
- Create the legend (HINT: It's not an image)
- Match the tooltip (Note the stats that are displayed in the tooltip. This will be a bit tricky. Essentially you need to count the number of players that are contained within each band.)
- The viz should update based on the stat selected. The user should be able to choose between: Attempts, Completions, Interceptions, Touchdowns, and Yards
- The title should update dynamically based on the stat the user selects.
- Optional: Use Montserrat font (you can download it from Google fonts)
If you have any questions or get stuck, either leave a comment on this post or tweet me. Good luck!
Subscribe to:
Post Comments
(
Atom
)


Hi andy,
ReplyDeleteI need your help in getting CY vs PY % change using LOD when Fiscal year start in month of April.
i saw your video it works good if fiscal yr starts in janand need help when it starts in April.
Regards,
Raghavender Allam