April 13, 2024
How to Create a Proportional Stacked Bar Chart in Tableau
Proportional stacked bar charts are a good way of showing the size and proportion of data at the same time.
April 6, 2024
18 Ways to Visualize Bar Charts in Tableau
The SECRET to never choosing the wrong chart...the Bar Chart! Here are 18 options for your next bar chart.
Tableau tutorial and workbook here.
December 8, 2020
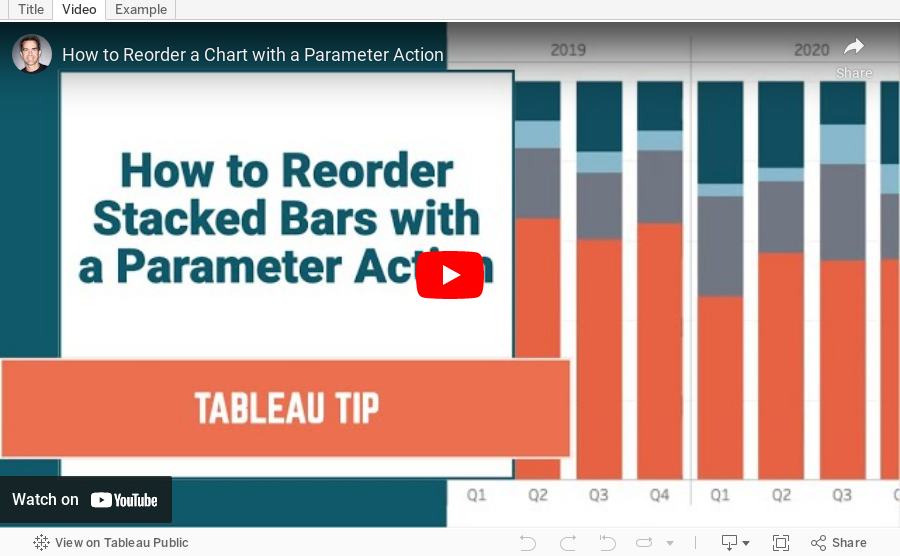
#TableauTipTuesday: How to Sort a Chart with a Parameter Action

- Build the chart
- Create a parameter
- Create a calculated field to sort the bars, then sort the Region field.
- Create de-highlight calculated field and place it on the Detail shelf
- Create a Parameter Action
- Create a Highlight Action
- Turn on Animations
- How to Reorder a Chart with a Set Action - https://www.vizwiz.com/2020/11/reorder-stacked-bars.html
- Data Set - https://data.world/vizwiz/superstore-20203
November 10, 2020
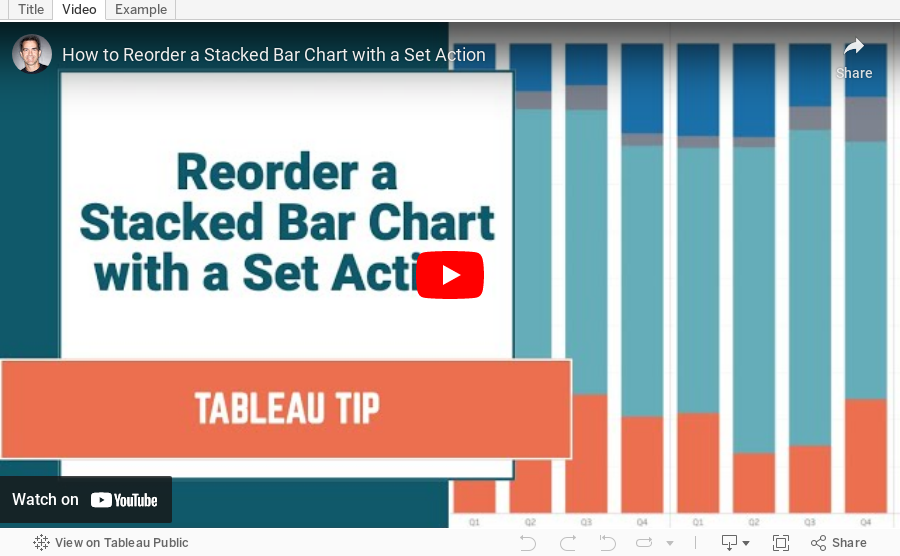
#TableauTipTuesday: How to Reorder a Stacked Bar Chart with Set Actions

September 28, 2020
#MakeoverMonday 2020 Week 39 - Child Marriage Around the World
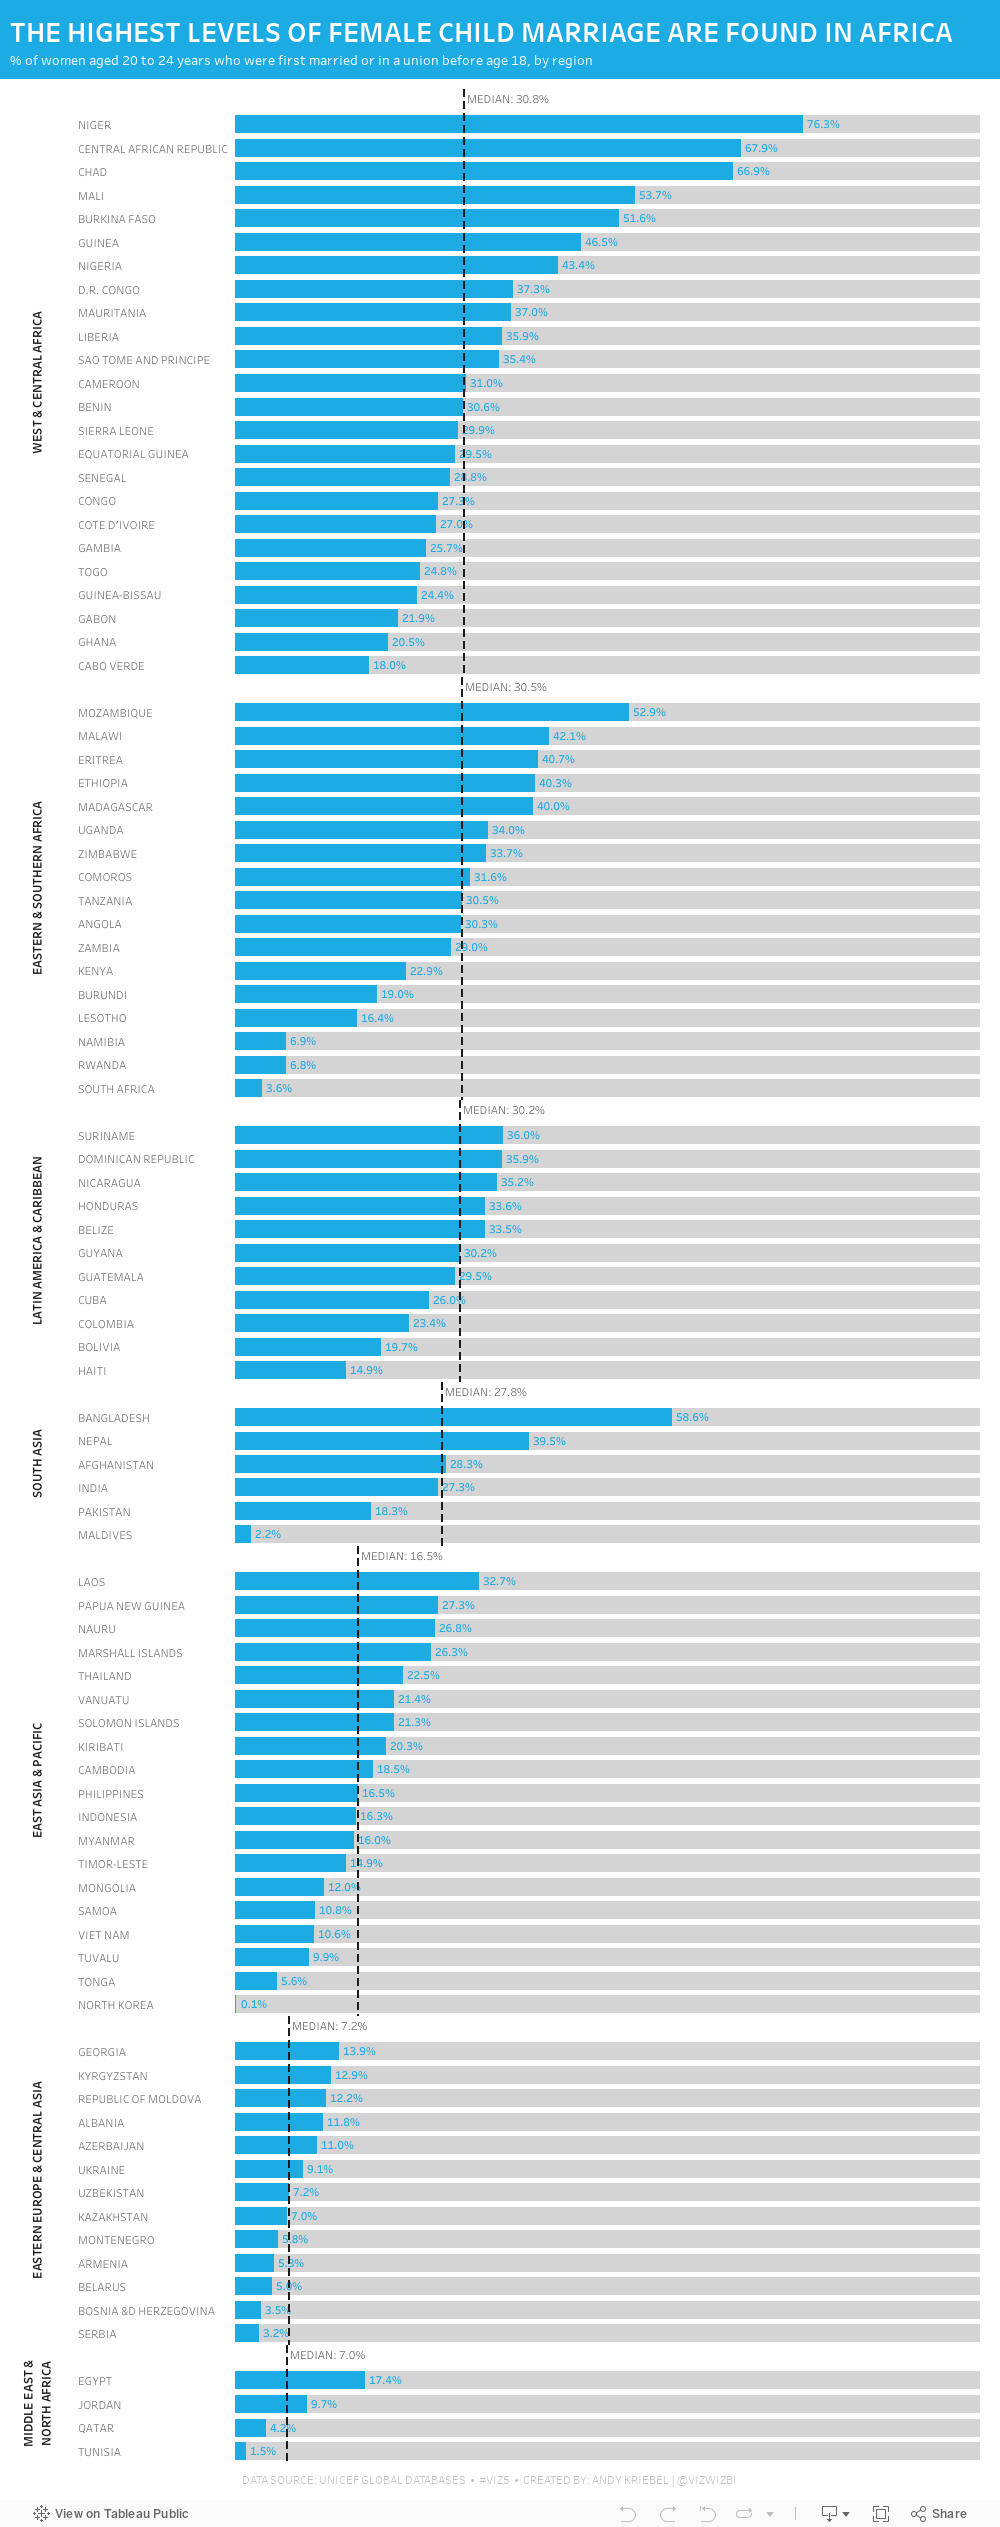
Week 39 brought another #Viz5 topic, this time it was about children that are now 20-24 who were married under the age of 18. Child marriage is, of course, horrific and it's a violation of human rights. Unicef has done an excellent job of recapping all of the issues and why these marriages happen on their website here.
As I've mentioned before, I ALWAYS find these Viz5 data sets tought. I'm not sure why; perhaps I have a mental block on them now. This week the data set was three columns: country, female %, and male %. That can't be too tough...right?
Well, I sure made it tough. First, I joined the data to regional mappings from Unicef so that I could possibly look at the data at the regional level; I decided to use medians for each region in the end. Then I went into Tableau and built a bunch of charts to explore the data. I used chart guides to help me think through options and none of them seemed to make any particularly interesting insights pop out.
After about two hours of nothing, I got the idea of simply looking at the % of females that were married under the age of 18. I ended up with a simple bar chart, which turned out to not be too far from the first chart I created a few minutes in.
Here's the #WatchMeViz video and below is the visualization. Thanks to those that watched live and contributed ideas along the way!! It really helps knowing others are there encouraging me.

August 10, 2012
Displaying time-series data: Stacked bars, area charts or lines…you decide!

First, let me say that this is a tremendous improvement over those produced by the U.S. Bureau of Alcohol, Tobacco, Firearms and Explosives (a.k.a. the ATF). Don’t bother reading the ATF report, unless you love 3D bar charts and 3D pie charts created in Excel.
A stacked bar chart is basically a pie chart unrolled to make a stick. And more often than not, when plotted as a time series, they do a poor job at showing the overall trends. Stacked bars are good up to three bars, no more. Why? Because it’s difficult to compare the heights of any of the bars except for the bottom bar, rifles in this case.
Let’s go through several alternative displays. If you’re interested in playing with the data, Matt published it here for me. Thank you Matt!
All of the charts below were built with Tableau. You can view an interactive version of all of these charts here and download the workbook here.
Let’s start with a redesigned stacked bar chart that uses Tableau’s built-in color blind palette.

Can you see the trends for each of the weapons? Maybe an area chart would be better.

Well, ok. Now the trends are easier to see, right? Area charts certainly improve the ability to see trends over time, but there are only two trends that give an accurate reading:
- The line at the top of the bottom area, i.e., rifles.
- The top of the top chart, which represents the total.
We still don’t have the ability to see the trends for any weapon except for rifles.
Before you read on, take out a piece of paper and sketch what you think the trend is for shotguns (light blue) based on the area chart above.
Ok. Now let’s compare the area chart above with the area chart for shotguns.

Did you come close? I doubt you did. Why? Because the tops of each color are influenced by the size of the colors below it, therefore making gauging the true size of each individual color extremely difficult.
Here’s another way to prove it. I know this isn’t a good way to represent the data, but bear with me, I’m trying to prove a point. If I overlay lines for each weapon over the area chart, look how different the shapes of the lines become.

Like most time-series data, your best way to represent the data is nearly always going to be a line chart.

Using a line chart we can quickly make some observations:
- There was a three-year spike in the early 90s for pistols made and there’s been a similar, but longer, surge since 2006. What was the cause of the big decline in 1995? Was there a change in handgun laws in 2005 or 2006?
- Revolvers were on a steady 20-year decline until 2005-2006. Is this merely coincidental with the pistols? Possibly so, possibly not.
- Rifles have increased recently, but shotguns have decreased. Are people buying rifles instead of shotguns? Their rate of variance since 1994 has grown consistently and the gap continues to get wider.
Using a line chart, you’re immediately asking questions of your data. Rapid-fire analysis!
When analyzing time-series data across several categories, consider not only looking at the raw numbers like above, but also review how each category contributes to the total. Let’s go through the same series of charts.

We’re off to a good start with the stacked bar chart. It looks like measuring the contribution of each weapon to the total may tell us something. Let’s try it as an area chart.

Not much better, other than it looks smoother. How about a line chart?

Ok, now we’re onto something. You might think that this is the same as the line chart for the raw numbers, and I can see how you might make that conclusion at a quick glance. But let’s look at them side-by-side.

The charts look very similar up until 1997, but then look at how many more rifles started to be made compared to the rest. And look at the drop off in percentage of shotguns produced since 2004.
Hopefully you’ve learned two main lessons:
- Don’t display time-series data as stacked bars (or pies unrolled onto on a stick if you prefer). The best medium for time-series data is a line chart.
- Consider looking at both the raw numbers and their contribution to the total. It’s always a good idea to look at your data in more than one way. You may get some additional and/or different insights.
Let me wrap with two charts that disturbed me a bit as I was playing with the data for this blog post. I’m not disturbed by their visual display, but by what they reveal.

The chart on the left is the running total of guns made by gun type since 1986. The chart on the right summarizes the chart on the left.
These charts tell us that the US has manufactured over 99 million guns since 1986. Seriously! 99 million! According to the US Census Bureau, there were ~238M Americans over 18. That means that approximately one of every five Americans 18 or older owns a gun.
That terrifies me!
Perhaps political interests (and lobbyists) have played a part?? For more information on how to use the US Census Bureau data, check out this guide.

UPDATE – Source CNN: This certainly explains the drop that started in 1994 and the subsequent increase in 2005.
The Clinton administration imposed a ban on several types of military-style semi-automatic rifles and high-capacity magazines in 1994, but that ban was allowed to lapse in 2004. Obama has proposed restoring the ban, requiring background checks for buyers at gun shows, and other "common-sense measures."
April 7, 2011
Internet Connections Speeds – Why Nielsen should avoid stacked column charts
Another interesting report released by Nielsen, this time they measured the internet connection speeds of nine countries. They presented the results as a stacked column chart.

One of the biggest problems with stacked bar or column charts is that it’s very difficult to compare values other than those at the bottom or top. In the Nielsen chart, it takes some time for your eyes to rank any of the measures other than “Above 8Mb”. I’ve turned to Tableau and presented several alternatives. Scroll through the tabs to see each.
I also used a parameter control to allow sorting by any of the measures. This allows you to quickly rank the countries for any of the speeds. My personal favorite is the “Favorite” tab. Which is yours? How else would you present the data?






