Showing posts with label arctic sea ice. Show all posts
July 25, 2023
The Big Thaw: Exploring the Disappearing Antarctic Sea Ice
antarctic
,
arctic sea ice
,
color
,
context
,
dashed lines
,
global warming
,
Guardian
,
highlight
,
how to
,
interactive
,
line chart
,
livestream
,
Makeover Monday
,
set action
,
tableau
,
time series
No comments

- Visualizations from chapter 12 of the Makeover Monday book that showed how to add context to visualizations
- Several of the vizzes from 2018 week 15, each with their own unique take on the data
- The original viz by The Guardian
In the end, I created 13 visualizations before settling on the viz most similar to the original. There were some great questions today on the livestream. Thank you for that.
When you watch this video, you will definitely learn something new. You'll also learn a lot about how I think through problems when I run into them.
Enjoy! Click on the image below the viz to interact or click here.
August 7, 2018
Makeover Monday: And The Ice Melts Away (as a Radial Chart)
arctic sea ice
,
Arpit Arora
,
data prep
,
flow
,
Laine Caruzca
,
Makeover Monday
,
Pablo Gomez
,
radial chart
,
Tableau Prep
,
workflow
No comments

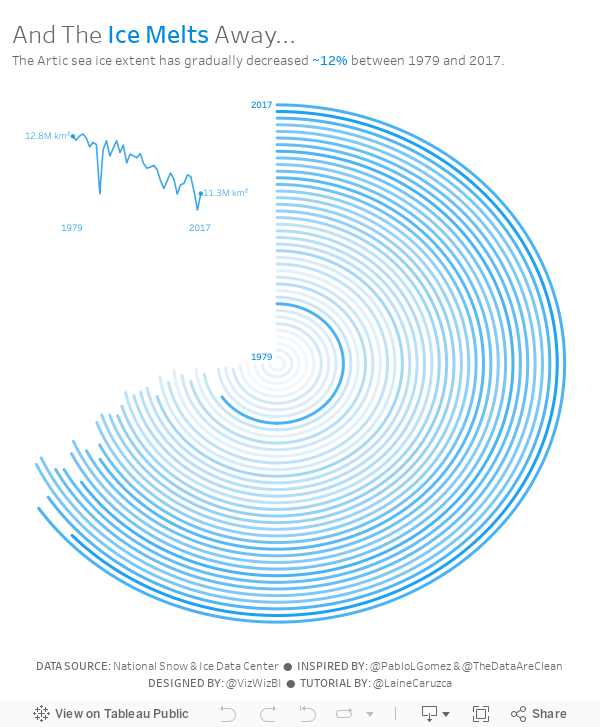
I'd never built a radial chart from scratch before, so I was excited to learn to build a second new chart type today. In Laine's tutorial, she used the Custom SQL option that's available in the Legacy data connector in Tableau for Windows. However, there's no custom sql option on a Mac, so I decided to create the data structure using Tableau Prep.
 |
| Download the Flow here |
This is a pretty straightforward workflow. You split the data into parts to create the start and end points, then union them back together, along with some cleanup along the way.
Laine provided all of the details of the table calcs and the bin needed to create the curves, so I follow her steps using the Arctic Sea Ice Extent data from Makeover Monday week 15. That worked rather perfectly!
From there it was on to the polish. I love Pablo Gomez's style, so I used this radial chart viz of his as inspiration for the overall design, and then I used the wording from Arpit Arora's Makeover Monday viz about the same topic to help frame the messaging.
April 9, 2018
Makeover Monday: Arctic Sea Ice is Disappearing Fastest in Summer Months
arctic sea ice
,
change
,
climate change
,
environment
,
global warming
,
line chart
,
Makeover Monday
,
melting
No comments
So when I found this visualization by the National Snow & Ice Data Center, it seemed an appropriate topic for Makeover Monday. One of the most fun elements of this data set is that it includes only two columns: date and sea ice extent.

What works well?
- Without even trying, it tells a compelling story.
- The interactivity is fabulous. I really like being able to simply click on an item on the legend to have it added or removed as a highlighted line.
- Including the 1981-2010 median along with the IQR and IDR provides great context.
- Defaulting the view to show 2012 (the previously worst year for arctic ice) to 2018 helps show how 2018 is looking to surpass 2012 (in a bad way) by a lot.
- Subtitle explains what sea ice extent means
- Good use of simple colors
- Great example of using highlighting for context
What could be improved?
- The x-axis could be simpler by only showing the month names and removing the word "Date" from the axis title.
- Make the title more impactful
My Goals
- First, I wanted to rebuild the original and see if I could make it any better. I couldn't.
- Second, build a spiral diagram that shows the months around the outside, but this only worked well when it was animated.
- Finally, I settled on a different take on the metric that swaps the months and year on the original. That is, put the year on the x-axis and month on each line. This gave me only 12 lines which looked less busy and helped me see patterns for each month.
- Next, I included a line that is the average of each year (black line).
- I then decided to look at how each year of each month changed compared to 1979. I went with a percent change because I think that provides more context.
- Lastly, I included a highlighter for the months and included some BANs of the actual values for comparison.
Click on the image for the interactive version.
April 29, 2013
Artic Sea Ice Volume: A Radar Graph vs. Line Graphs
arctic sea ice
,
chart junk
,
comparison
,
line chart
,
radar graph
,
seasonality
,
tableau
,
year over year
No comments
UPDATE (May 2, 2013): I have removed 2013 from all charts.
I posted an article on my Facebook page the other day asking if this radar graphs about artic sea ice volume works. The comments were mixed.

I think this radar graph is merely ok. Radar graphs, in general, are hard to read because relationships and trends are not easily discerned. Some of the issues I see with this graph include:
- It’s difficult to see the entire pattern over time. I see the pattern is spiraling in, but does it change year by year. Ask yourself this: How does 1999 compare with 2004? It takes a lot of work.
- It’s very hard to follow the ice volume labels around the chart. I bet you found this as well in the example above.
- The author only included September. Why? The data is available by day. Get the data here.
- Are there any seasonal patterns? You can’t answer this question.
I created a couple of different views for your consideration in Tableau. You can download the workbook here.

In my version, I’ve addressed all of the problems I mentioned above.
- In the upper left graph, you can easily see that the artic sea ice volume is trending down.
- The upper right chart allows you to see two things:
- The seasonal patterns
- Comparisons by year: The comparisons across years can be see because the years get darker as the data gets closer to 2013. You can see the lines get darker as you look down the graph.
- The Daily Volume graph makes the cyclical patterns much, much clearer.
How would you visualize this data? Do you agree that these line graphs work better than the radar graph?
Subscribe to:
Posts
(
Atom
)






