Showing posts with label seasonality. Show all posts
August 17, 2022
Analyzing Seasonality with Cycle Plots
analysis
,
calculated field
,
change
,
color
,
context
,
cycle plot
,
difference
,
how to create a cycle plot
,
line chart
,
reference line
,
seasonality
,
table calculation
,
tableau
,
time series
,
tip
,
variance
No comments
Reference:
Introduction to Cycle Plots by Naomi Robbins
Inspired by: Jon Schwabish
Download the workbook here.
April 16, 2018
Makeover Monday: The Seasonality of Confirmed Malaria Cases in Zambia Southern Province
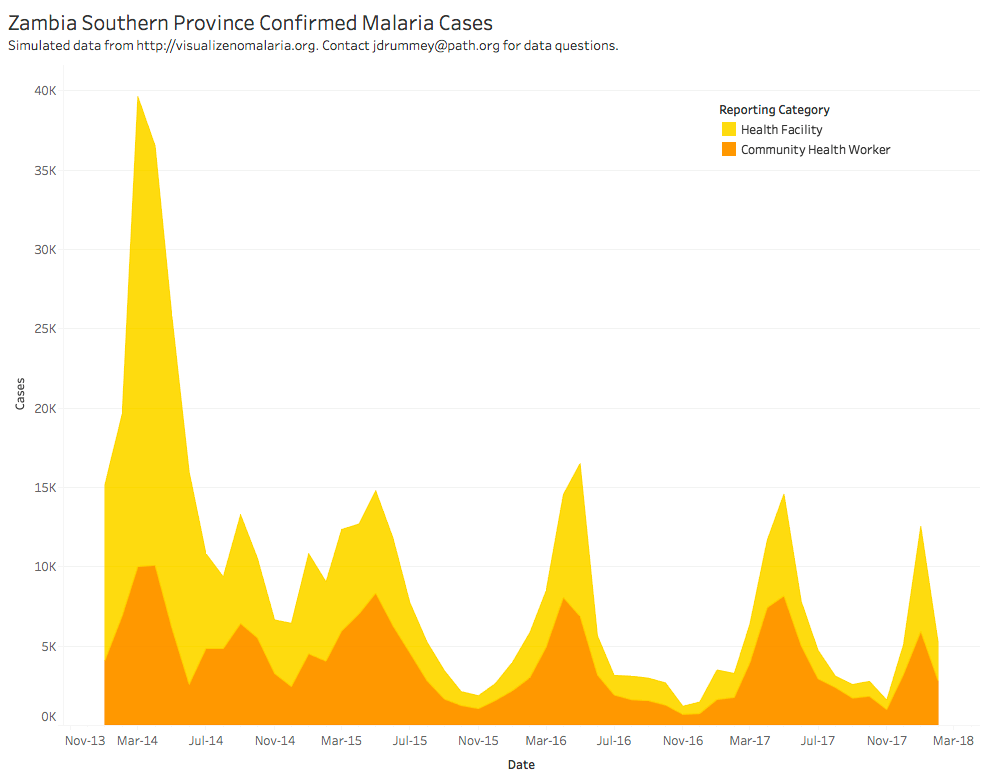
What works well?
- The colors are distinct from each other.
- The seasonality is very evident.
- The title is simple and tells us what theviz is about.
What could be improved?
- Are the colors stacked or is one behind the other?
- The overall decline is harder to see than necessary.
- What happened at the spikes? Adding some annotations would be helpful.
- Why is the data split between health facilities and health workers?
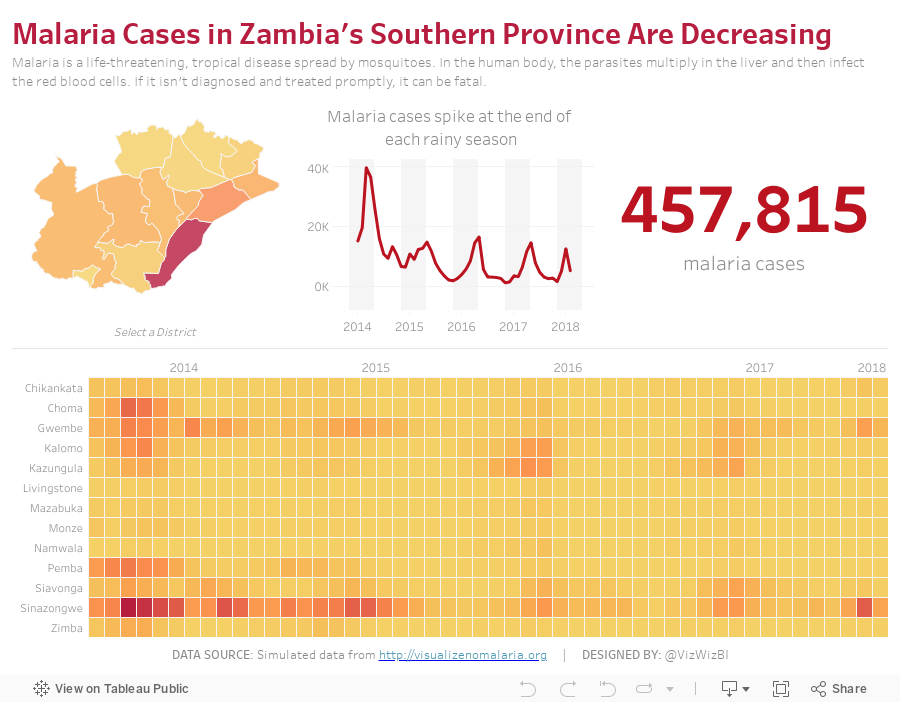
My Goals
- Can I show the overall decline more effectively?
- What does the viz look like when I combine the health facilities and health workers?
- Are there colors that will work more effectively?
- How can I make the seasonality more evident?
With those goals in mind, here is my Makeover Monday week 16. If this looks somewhat familiar, I created a very similar viz with a very similar data set for Makeover Monday week 34 2016.
October 25, 2017
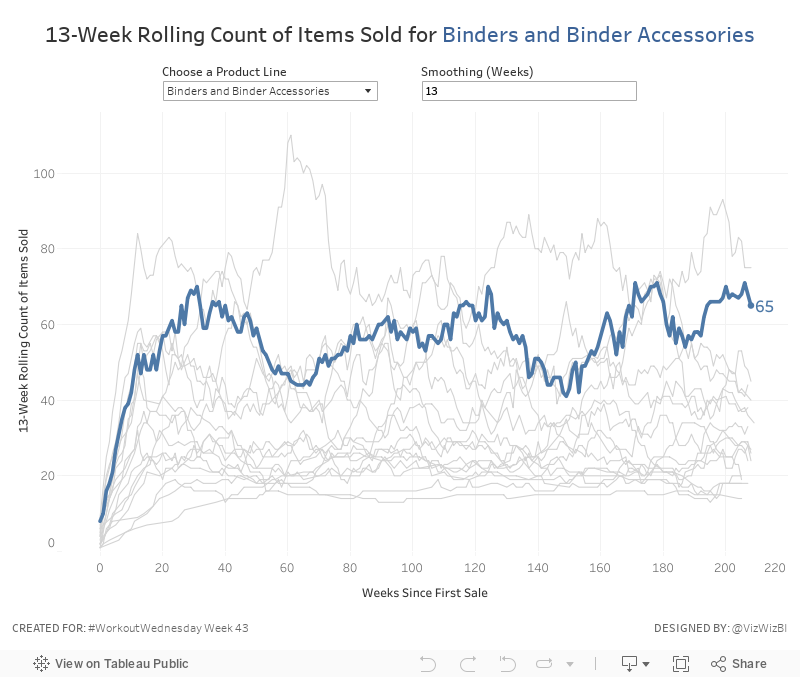
Workout Wednesday: The Seasonality of Superstore
This week's challenge builds upon Ben's work. First, you'll need this version of Superstore (which is different to Ben's but the same one I normally use for WW).Anyone ever noticed a seasonal trend in the number of products sold in the binder category before? #SampleSuperstoreInsights @tableau pic.twitter.com/zmTJeli7Yv— Ben Moss (@benjnmoss) October 15, 2017
Here are your requirements:
- Create a line chart of the rolling N week cumulative products sold since the first week each product sub-category was sold. In this case, a product sold is the count of the product names.
- Allow the user to pick a sub-category to highlight. Make it blue and all others grey.
- The sub-category highlighted should also be slightly thicker than all other sub-categories.
- Allow the user to define the number of weeks over which to compute the smoothing. The user should only be able to enter values between 8 and 52.
- The title and the y-axis should update dynamically based on the number of weeks entered for the smoothing.
- Match the tooltip in the chart
That's it! Nothing overly complicated this week. Good practice for calculations though! Enjoy!
April 29, 2013
Artic Sea Ice Volume: A Radar Graph vs. Line Graphs
arctic sea ice
,
chart junk
,
comparison
,
line chart
,
radar graph
,
seasonality
,
tableau
,
year over year
No comments
UPDATE (May 2, 2013): I have removed 2013 from all charts.
I posted an article on my Facebook page the other day asking if this radar graphs about artic sea ice volume works. The comments were mixed.

I think this radar graph is merely ok. Radar graphs, in general, are hard to read because relationships and trends are not easily discerned. Some of the issues I see with this graph include:
- It’s difficult to see the entire pattern over time. I see the pattern is spiraling in, but does it change year by year. Ask yourself this: How does 1999 compare with 2004? It takes a lot of work.
- It’s very hard to follow the ice volume labels around the chart. I bet you found this as well in the example above.
- The author only included September. Why? The data is available by day. Get the data here.
- Are there any seasonal patterns? You can’t answer this question.
I created a couple of different views for your consideration in Tableau. You can download the workbook here.

In my version, I’ve addressed all of the problems I mentioned above.
- In the upper left graph, you can easily see that the artic sea ice volume is trending down.
- The upper right chart allows you to see two things:
- The seasonal patterns
- Comparisons by year: The comparisons across years can be see because the years get darker as the data gets closer to 2013. You can see the lines get darker as you look down the graph.
- The Daily Volume graph makes the cyclical patterns much, much clearer.
How would you visualize this data? Do you agree that these line graphs work better than the radar graph?
Subscribe to:
Posts
(
Atom
)






