October 25, 2017
Workout Wednesday: The Seasonality of Superstore
This week's challenge builds upon Ben's work. First, you'll need this version of Superstore (which is different to Ben's but the same one I normally use for WW).Anyone ever noticed a seasonal trend in the number of products sold in the binder category before? #SampleSuperstoreInsights @tableau pic.twitter.com/zmTJeli7Yv— Ben Moss (@benjnmoss) October 15, 2017
Here are your requirements:
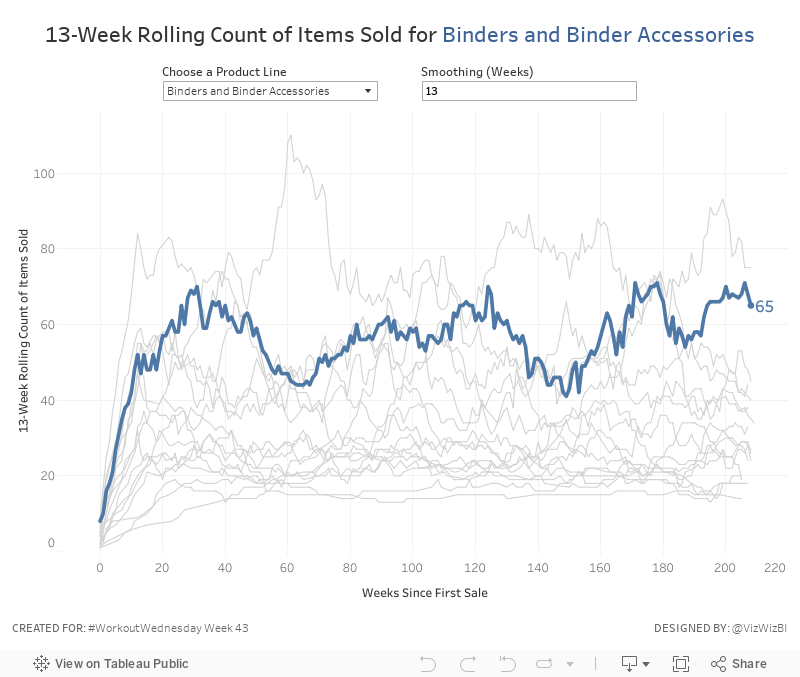
- Create a line chart of the rolling N week cumulative products sold since the first week each product sub-category was sold. In this case, a product sold is the count of the product names.
- Allow the user to pick a sub-category to highlight. Make it blue and all others grey.
- The sub-category highlighted should also be slightly thicker than all other sub-categories.
- Allow the user to define the number of weeks over which to compute the smoothing. The user should only be able to enter values between 8 and 52.
- The title and the y-axis should update dynamically based on the number of weeks entered for the smoothing.
- Match the tooltip in the chart
That's it! Nothing overly complicated this week. Good practice for calculations though! Enjoy!
Subscribe to:
Post Comments
(
Atom
)


Hi Andy. Is it possible to automatically highlight the line by clicking on it? So when I click on the line, it will be automatically selected in the parameter and highlighted.
ReplyDeleteYou can highlight the whole line when you click on it with a highlight action. Set the action to highlight itself based on the dimension of the line. But it won’t automatically put that in the parameter.
Delete