August 7, 2018
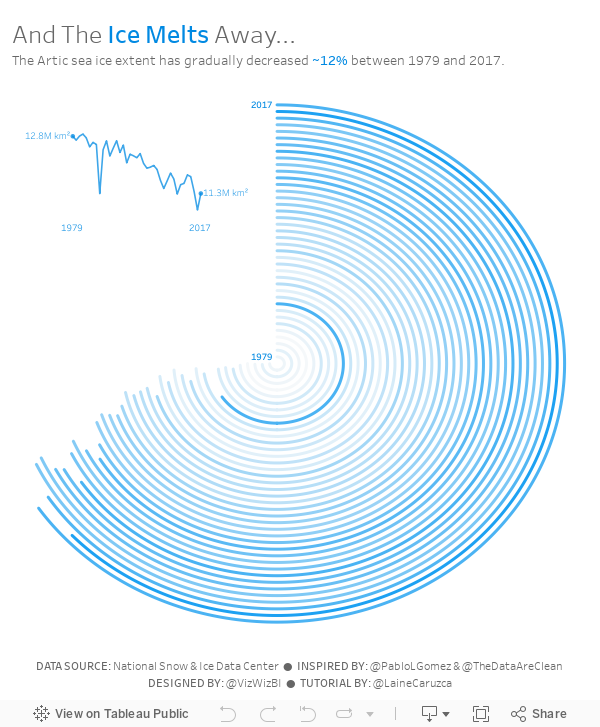
Makeover Monday: And The Ice Melts Away (as a Radial Chart)
arctic sea ice
,
Arpit Arora
,
data prep
,
flow
,
Laine Caruzca
,
Makeover Monday
,
Pablo Gomez
,
radial chart
,
Tableau Prep
,
workflow
No comments


I'd never built a radial chart from scratch before, so I was excited to learn to build a second new chart type today. In Laine's tutorial, she used the Custom SQL option that's available in the Legacy data connector in Tableau for Windows. However, there's no custom sql option on a Mac, so I decided to create the data structure using Tableau Prep.
 |
| Download the Flow here |
This is a pretty straightforward workflow. You split the data into parts to create the start and end points, then union them back together, along with some cleanup along the way.
Laine provided all of the details of the table calcs and the bin needed to create the curves, so I follow her steps using the Arctic Sea Ice Extent data from Makeover Monday week 15. That worked rather perfectly!
From there it was on to the polish. I love Pablo Gomez's style, so I used this radial chart viz of his as inspiration for the overall design, and then I used the wording from Arpit Arora's Makeover Monday viz about the same topic to help frame the messaging.
Subscribe to:
Post Comments
(
Atom
)


No comments
Post a Comment