August 9, 2018
History of the Premier League Table
england
,
English Premier League
,
ESPN
,
football
,
highlight
,
line chart
,
rank
,
soccer
,
stepped lines
No comments
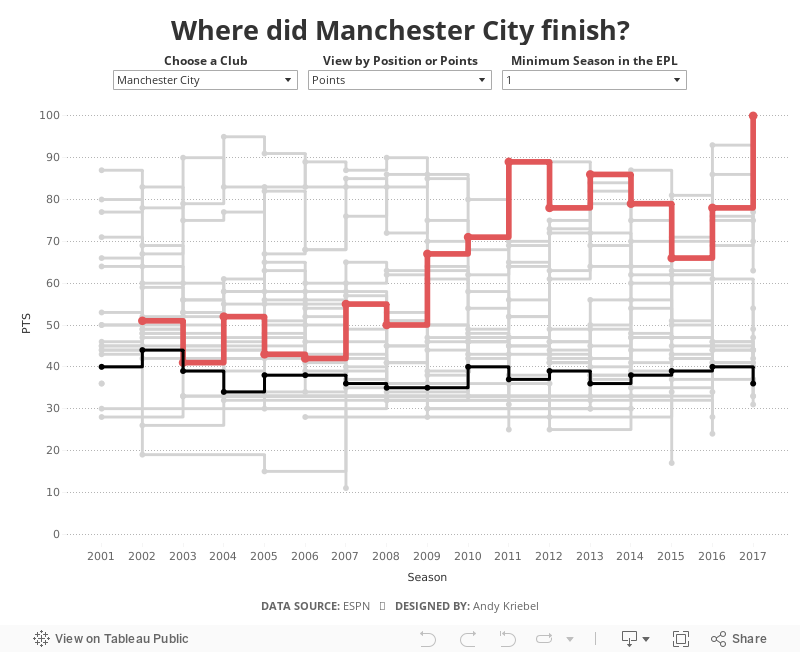
The 2018-19 Premier League season kicks off tomorrow night with an enticing match between Manchester United and Leicester City. This reminded me about a viz I had created at the end of the last season as a way of practicing stepped lines in Tableau.When I originally created this, I had to use table calcs to get the stepped lines to work, which can get complicated and is very time consuming. Now with stepped lines, it merely a matter of changing the lines type.
I decided to add in a couple of user options:
- Which team do you want to highlight?
- How do you want to compare the teams? By total points for the season of the final position in the table?
- Not all teams have been in the EPL for all 17 years, so I provided an option to filter down to just the teams that have been in the EPL for the user specified number of years.
And here's the viz for you to explore. Enjoy!

Subscribe to:
Post Comments
(
Atom
)


No comments
Post a Comment