Showing posts with label market basket analysis. Show all posts
October 19, 2017
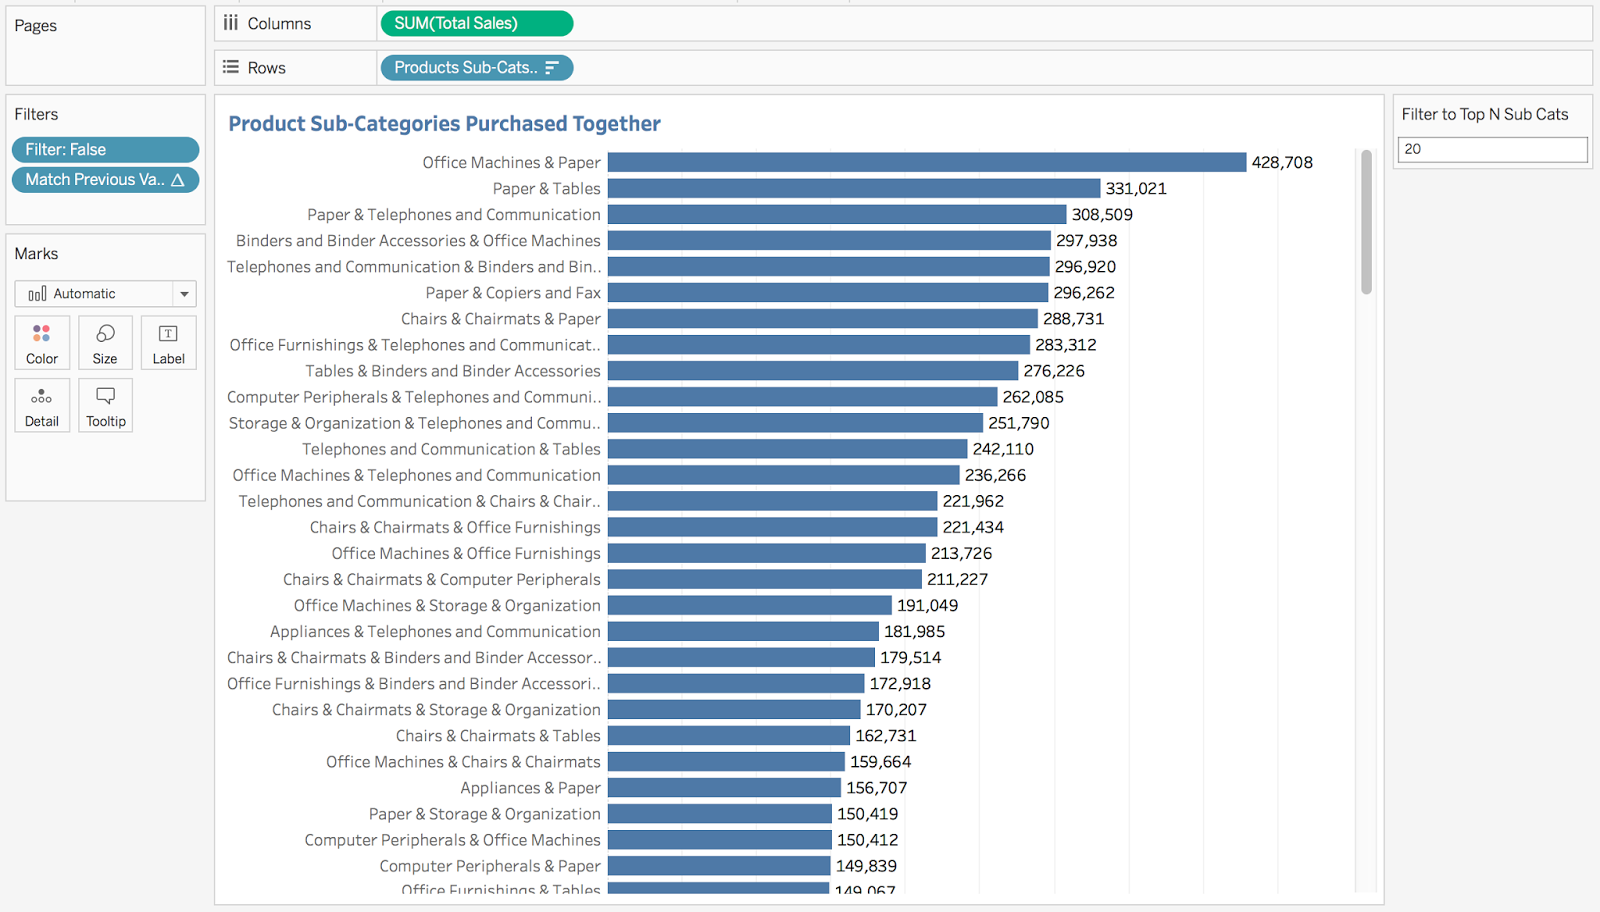
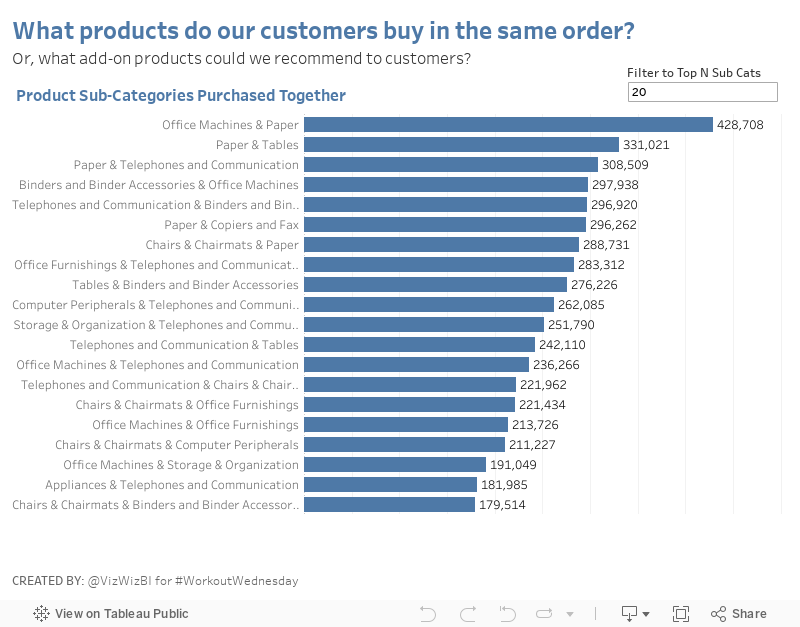
Workout Wednesday: Market Basket Analysis
cross selling
,
market basket analysis
,
self-join
,
table calc
,
table calc filter
,
Workout Wednesday
8 comments
Emma indicated that you would need to use a PC and I'm on a Mac. This, however, didn't pose a challenge.
STEP 1: Join the data to itself
The idea here to join the two Orders tables by Order ID. This self-join allows us to see the cross selling of each line item in each Order ID with all other line items with the same Order ID.
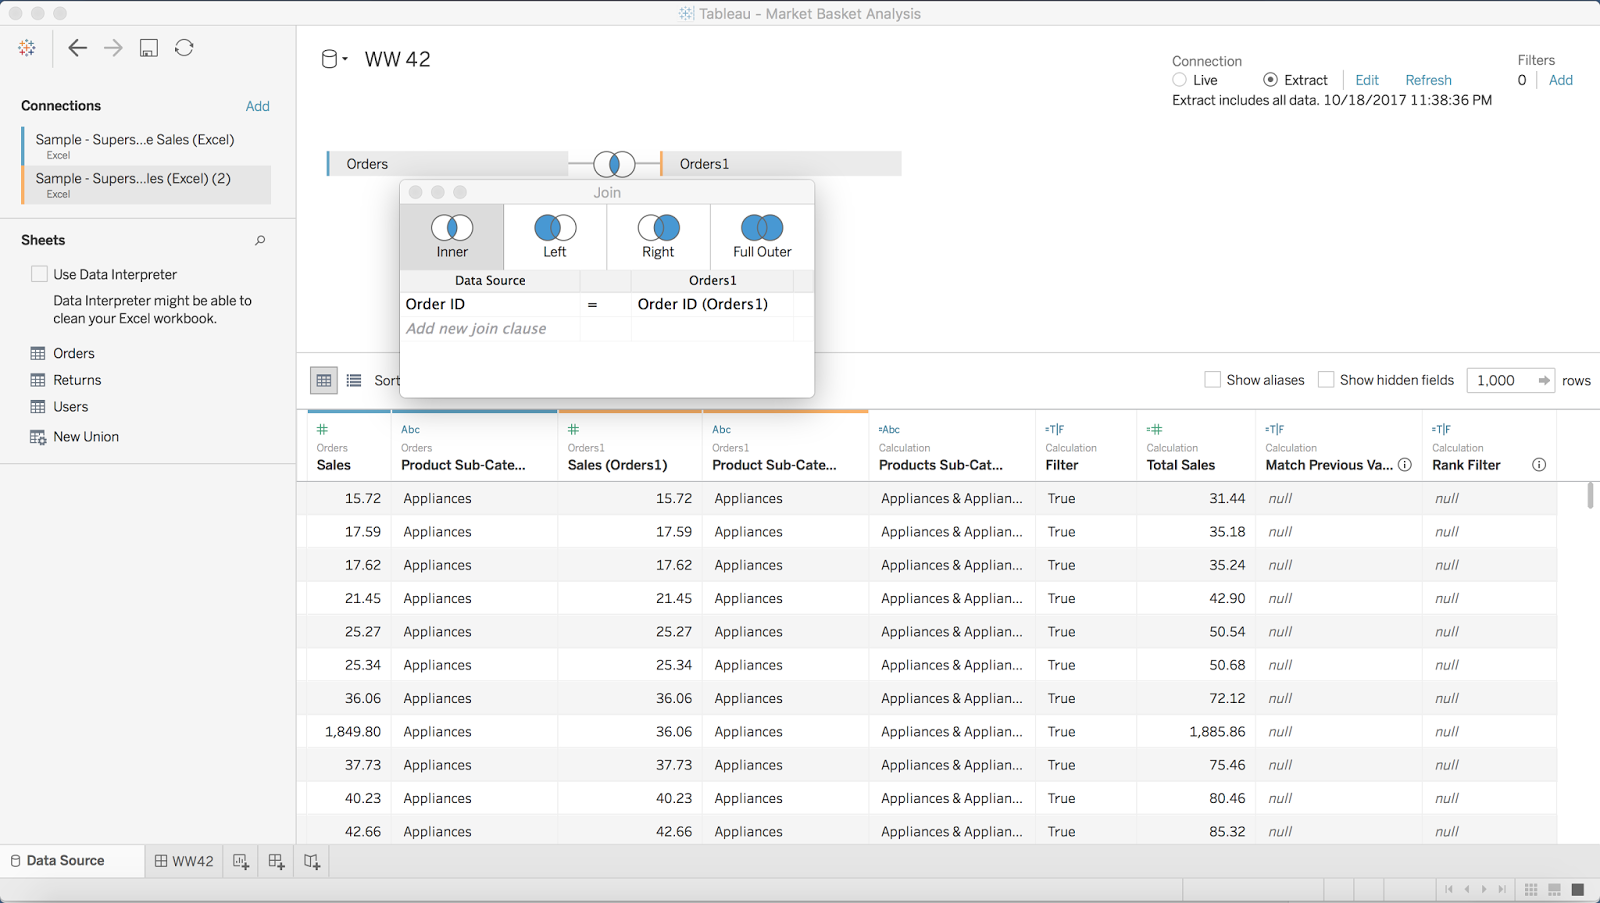
STEP 2: Filter out sub-categories that are the the same in both data sources
The goal of this filter is to remove any product sub-category that joins to a product sub-category with the same name. To do this, I created a simple boolean calculation, then added it to the Filters shelf and selected False.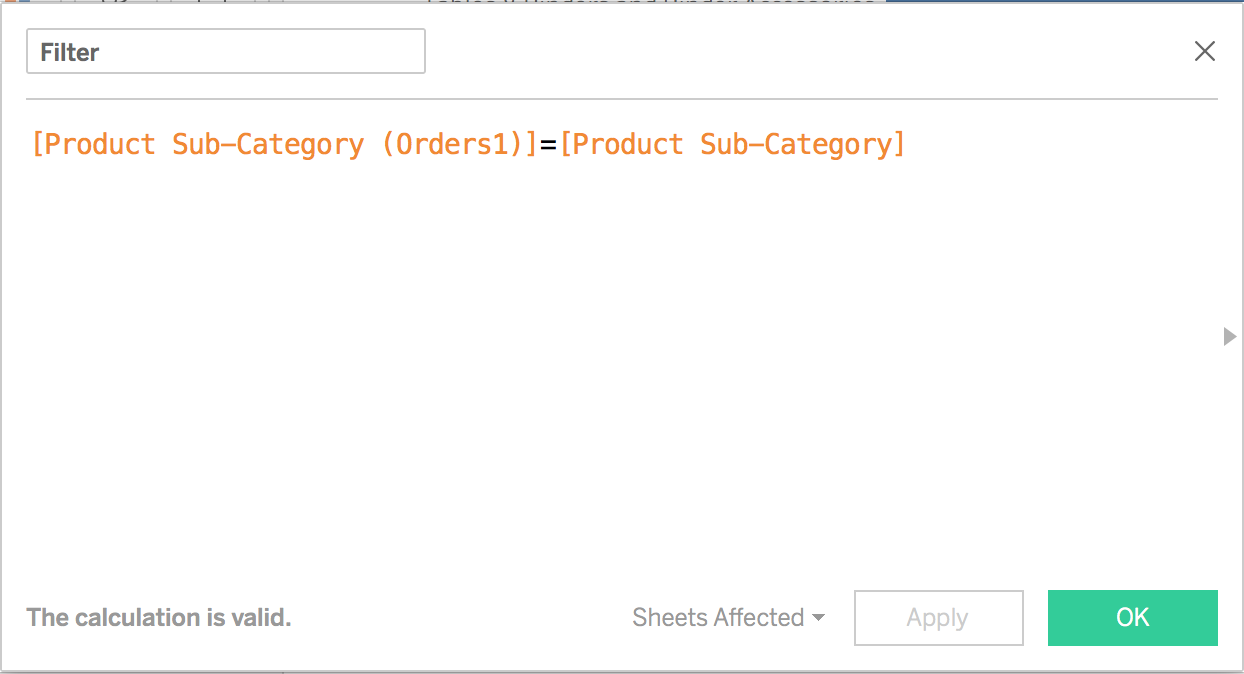
STEP 3: Create a Total Sales calculation
This is pretty straight forward. Simply take the two sales measures and add them together.

STEP 4: Combine the sub-categories to get a list of the products that sold together
You could do this with a combined field, I merely prefer to write the calculation.

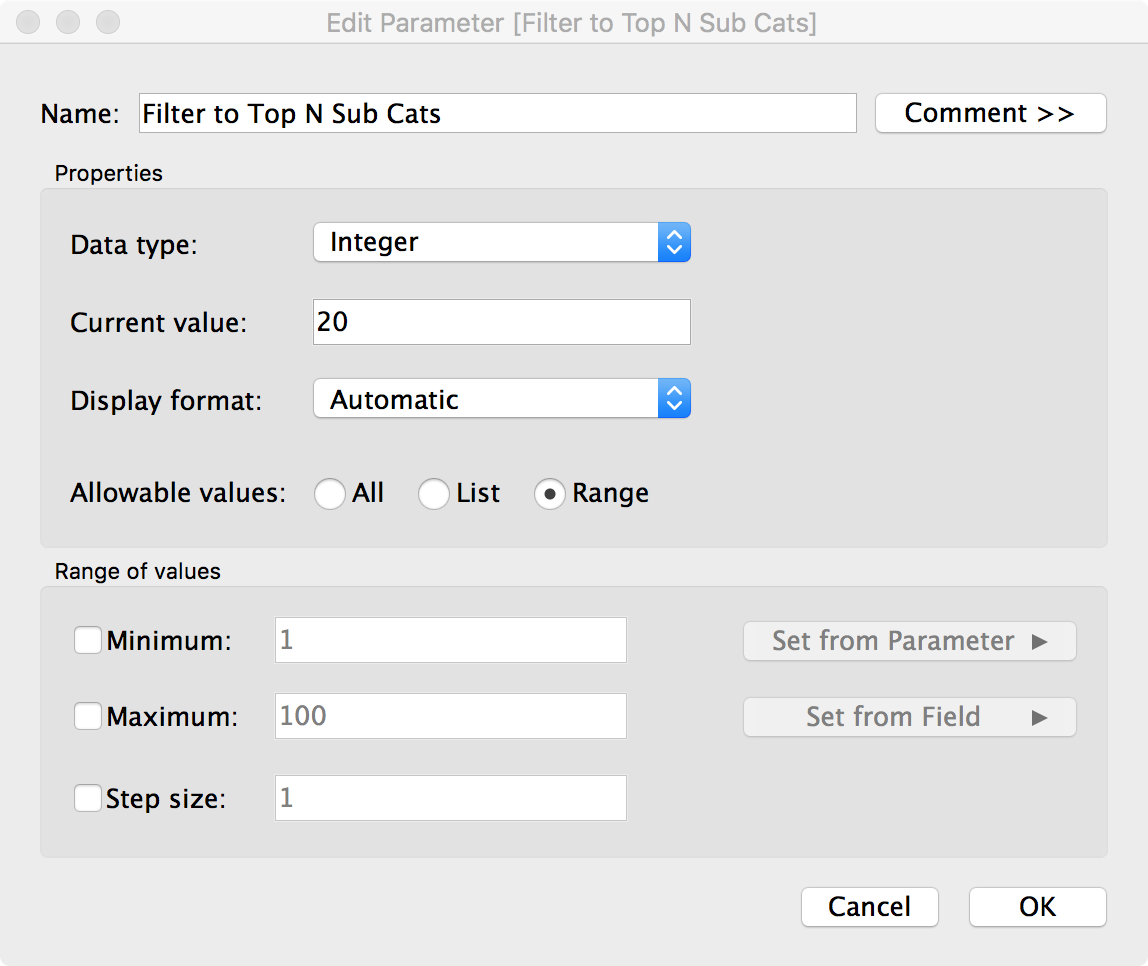
STEP 5: Create the Top N parameter and show the parameter control
STEP 6: Build a bar chart of the sub-categories purchased together sorted by Total Sales

Notice that I now have every combination of product sub-categories purchased together duplicated. I'll need a couple table calcs to fix this.
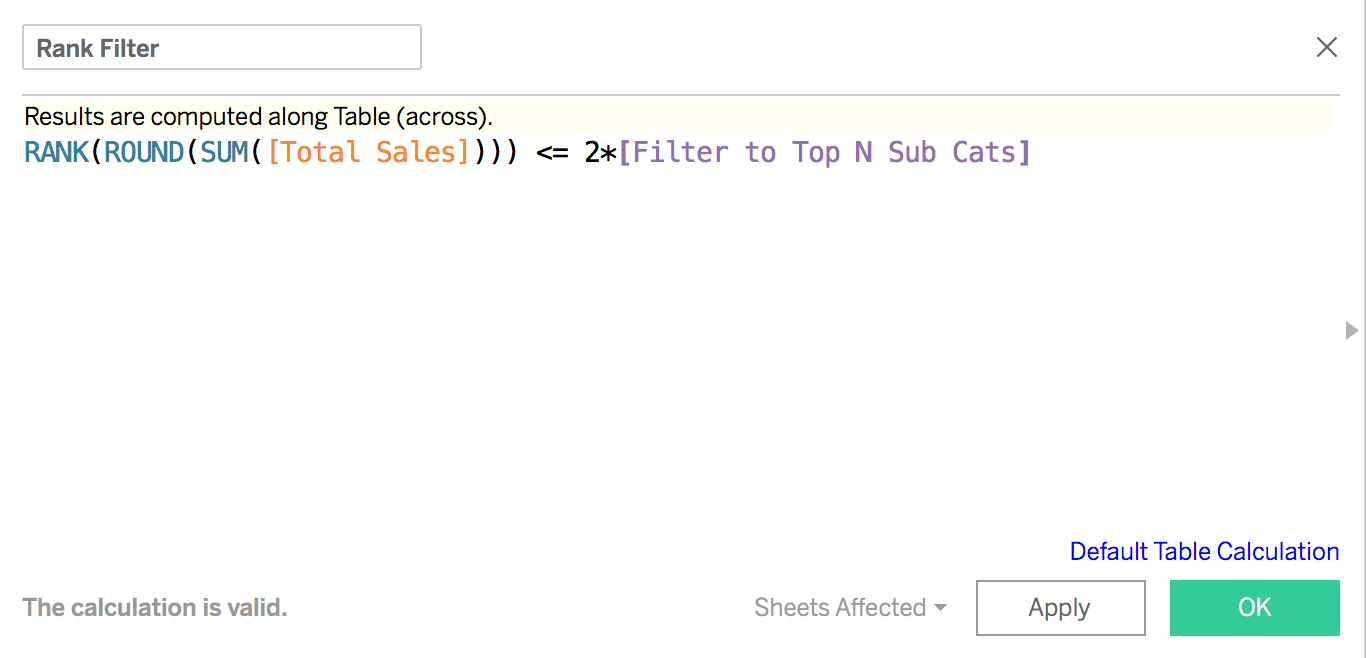
STEP 7: Check if the current row matches the previous row
With this calculation, I'm checking for duplicates. If I get "True" back as a result, then that means it's a duplicate. Notice here that I'm rounding the sales. I had to do this because Tableau wasn't matching the sales for some reason.
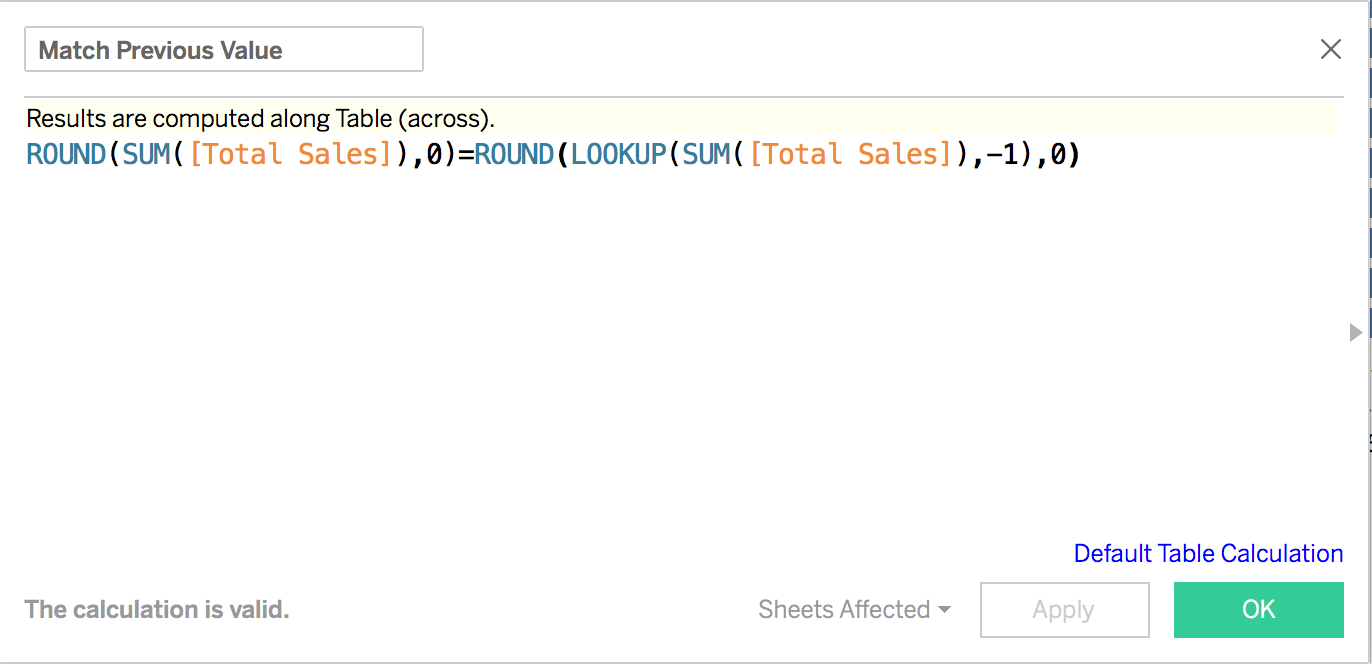
By excluding the "True" results with a table calc filter, I now have removed the duplicates.
STEP 8: Filter to the top N sub-categories
Again, I need a table calc filter. I need to rank the total sales, but since I have twice as many records (the previous table calc filter essentially just "hides" the other rows), I need to take twice as many rows as I indicate in the parameter.
Drag this calc to the Filters shelf and choose True and I have the results I want.
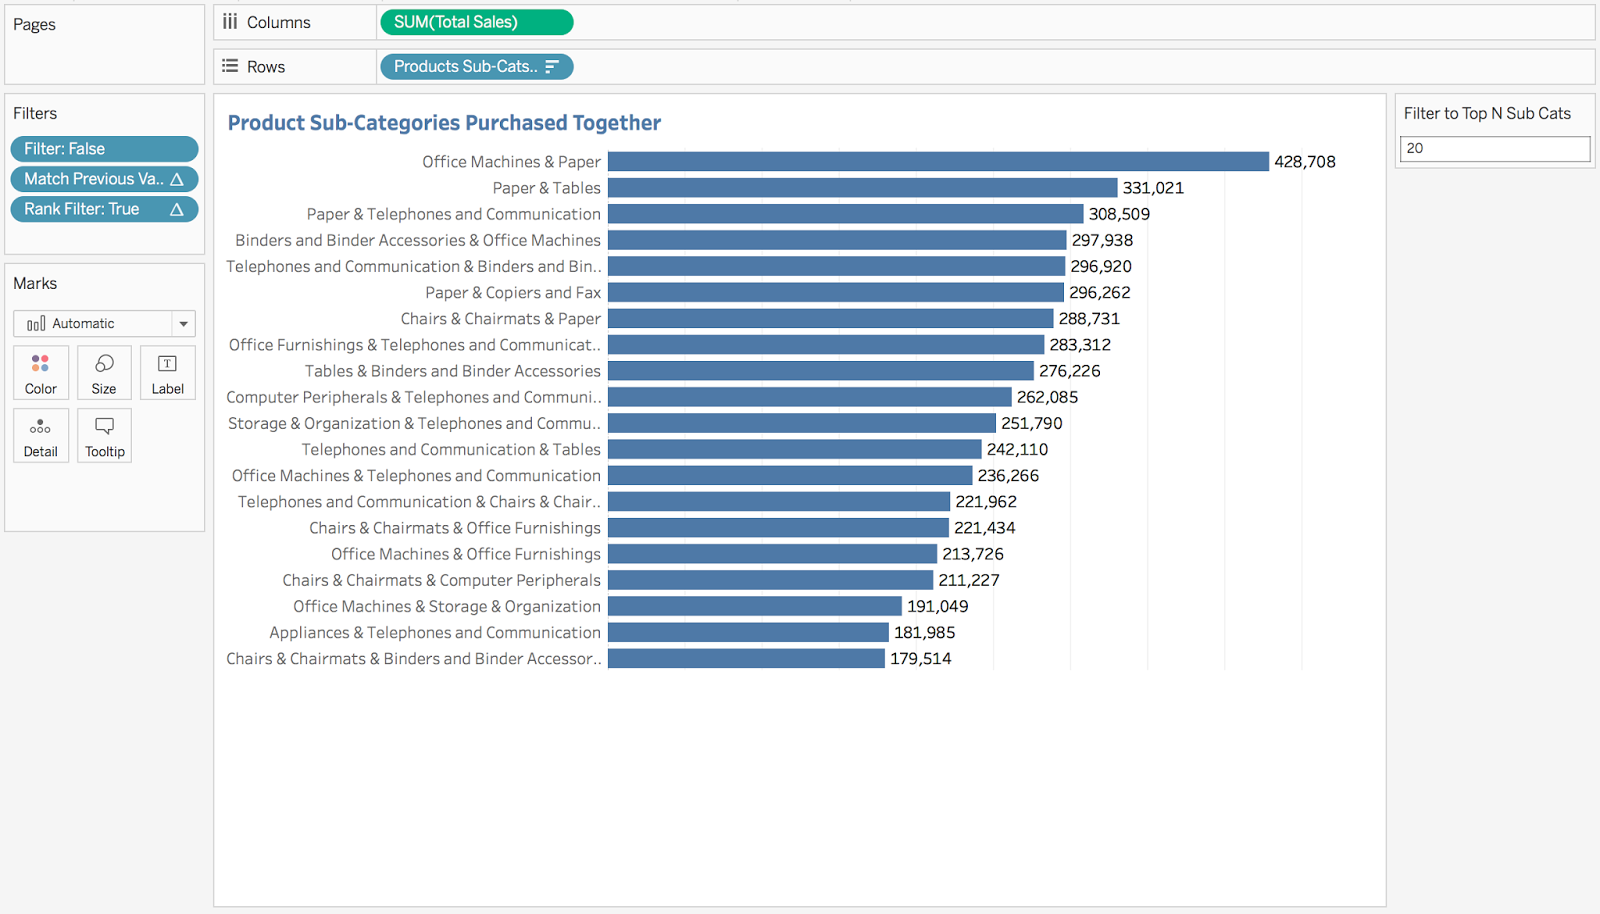
STEP 9: Build the final dashboard
Subscribe to:
Posts
(
Atom
)


