June 17, 2010
Something's missing
energy
,
flickr
,
oil
No comments
I like the message in this graph, but the chart itself is missing something very fundamental...the scale. How can we possibly compare values without the scale? The scale could be 0-1, it could be 0-1,000,000,000 or it could be 500-1,500. Who knows?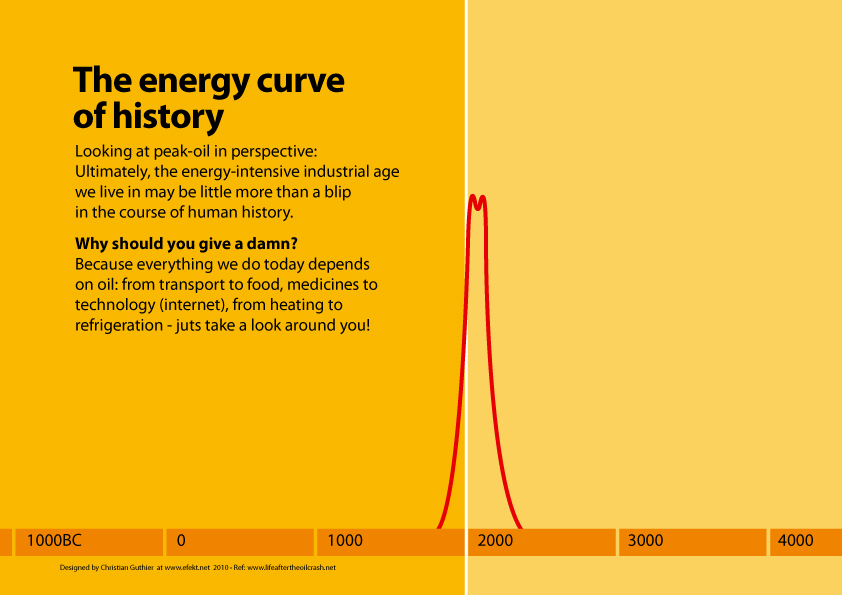
Subscribe to:
Post Comments
(
Atom
)


No comments
Post a Comment