Showing posts with label world indicators. Show all posts
March 29, 2017
Workout Wednesday: Benford's Law
bar chart
,
benford's law
,
challenge
,
probability
,
statistics
,
Workout Wednesday
,
world indicators
6 comments
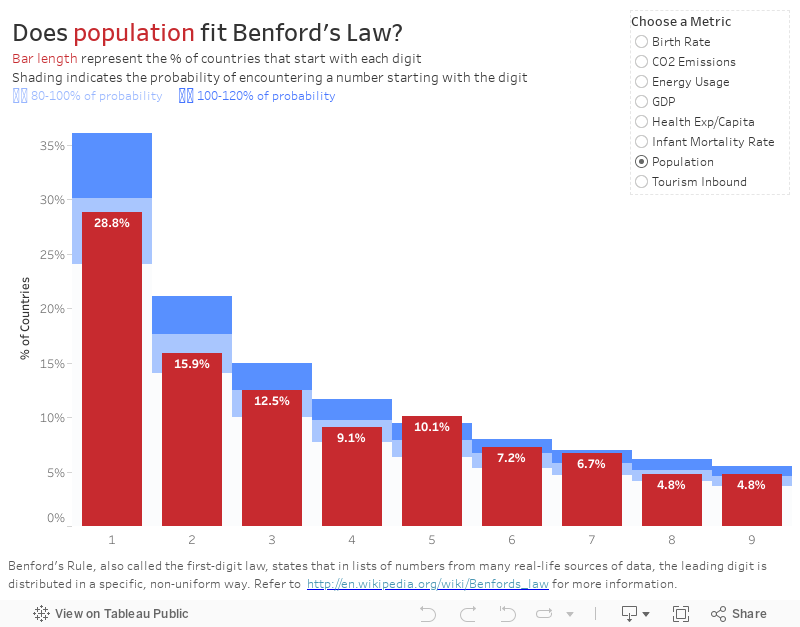
Benford's law, also called the first-digit law, is an observation about the frequency distribution of leading digits in many real-life sets of numerical data. The law states that in many naturally occurring collections of numbers, the leading significant digit is likely to be small. For example, in sets which obey the law, the number 1 appears as the most significant digit about 30% of the time, while 9 appears as the most significant digit less than 5% of the time. By contrast, if the digits were distributed uniformly, they would each occur about 11.1% of the time.This leads us to the Workout Wednesday week 13 challenge. Let's build a chart about Benford's law based on the World Indicators datasource that comes with Tableau. You can download it here.
Here are the guidelines:
- Data should reflect 2010 only
- User should be able to pick between the eight metrics you see listed
- Zeros and nulls should be excluded
- Match my title and subtitle exactly
- Match my colors throughout
- Each bar represents the % of countries that end with that number for the metric selected
- No tooltips
- Labels for the bars should be on the inside-top of each bar
- The lighter blue bars behind the red bars indicate the "expected" outcome of Benford's law. Notice those don't change even when the user changes the metric.
- Dashboard layout is 800x600
- You cannot use LOD expressions
This shouldn't be too terribly challenging. For me, it was fun to learn about what Benford's law is and see it in action. Good luck!
Subscribe to:
Posts
(
Atom
)






