September 5, 2013
Tableau Tip: Default a date filter to the last N days
calculated fields
,
dates
,
default
,
last
,
parameters
,
tableau
,
tips
,
tricks
29 comments
A common question that I see on the forums and on our Facebook group is “How can I default my date quick filter to always show the last N days?” This is a relatively simple problem to address using parameters instead of quick filters. This solution also works because you’re not dependent on leveraging the today() function. This works because it looks at the last date in your view, not your computer’s clock.
If you use quick filters, when you publish your workbook to Tableau Server, the latest view that you see in Desktop is what gets published. So, if you use a date range quick filter like this

and your data source refreshes overnight, the slider does not automatically shift to the right. In addition, the slider also shows dates all the way up to today, even if your latest date is one month ago. Hence, if you filter to the last two weeks you could get no results, leaving your viewers a bit perplexed.
Here’s the method I use that always defaults to the latest N days.
Step 1 – Create a parameter that allows the user to input the last N of days they want to view. Then show the parameter control.

Step 2 – Parameter controls don’t do anything in Tableau unless you created a calculated field to leverage them. In this case, let’s create a calculated field that flags days that are within the range entered in the parameter.

Let’s check if this works by creating a simple table.
![image[66]](https://blogger.googleusercontent.com/img/b/R29vZ2xl/AVvXsEgXS955uCwfwP4FtZwnFMgnFz0HmOXe3tH4AA5OuP0dghDHCW8XeE5Pvz92-QpenAMnku9_UkIvaVhx0qFRrNvOAf3gKqAJ5kjSxSPBjEWbtoMefOIcDBlV2xDVyZ3WvglfZz004v0eeFE/?imgmax=800 "image[66]")
Perfect! We can see that our “Days to Show” field shows false when the date is more than 7 days from the last date.
Step 3 – We don’t need our “Days to Show” field in the view and we only care about the “True” results, so let’s move it to the Filters shelf. Select True, then change the Computing using to Order Date. Yes, I could use Table (Across), but I prefer to have more control.

The filter selection will appear again. Choose True.
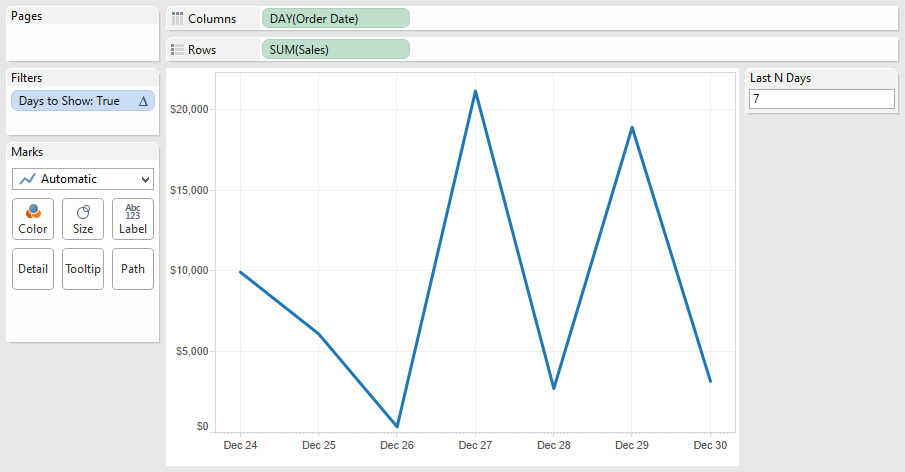
Step 4 – Build your visualization. First, let’s build a line chart.
If you use quick filters, when you publish your workbook to Tableau Server, the latest view that you see in Desktop is what gets published. So, if you use a date range quick filter like this

and your data source refreshes overnight, the slider does not automatically shift to the right. In addition, the slider also shows dates all the way up to today, even if your latest date is one month ago. Hence, if you filter to the last two weeks you could get no results, leaving your viewers a bit perplexed.
Here’s the method I use that always defaults to the latest N days.
Step 1 – Create a parameter that allows the user to input the last N of days they want to view. Then show the parameter control.

Step 2 – Parameter controls don’t do anything in Tableau unless you created a calculated field to leverage them. In this case, let’s create a calculated field that flags days that are within the range entered in the parameter.

Let’s check if this works by creating a simple table.
![image[66]](https://blogger.googleusercontent.com/img/b/R29vZ2xl/AVvXsEhPu-SnYUyHn5lT6y6vbB91RKgz92cMoI-G9rttScaxiJo56EFu7EHV9CVU2ah2zvwHNt0YwqkYipFJ6TKrbDxFYVk25IpgCeMG8-rxxfVt4hRN2Jb2Q2ac4eiJXkbIkY8iuo_mITAW1KI/s1600-h/image%25255B66%25255D%25255B12%25255D.png "image[66]")
Perfect! We can see that our “Days to Show” field shows false when the date is more than 7 days from the last date.
Step 3 – We don’t need our “Days to Show” field in the view and we only care about the “True” results, so let’s move it to the Filters shelf. Select True, then change the Computing using to Order Date. Yes, I could use Table (Across), but I prefer to have more control.

The filter selection will appear again. Choose True.
Step 4 – Build your visualization. First, let’s build a line chart.
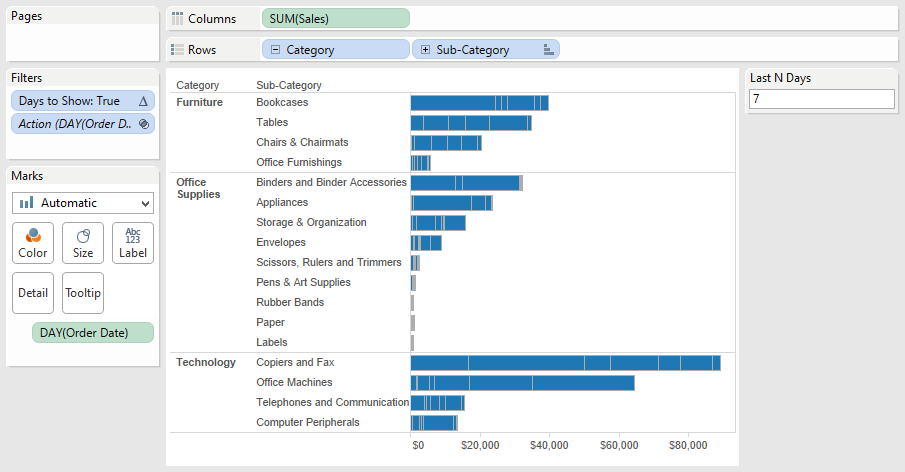
Next, let’s build a bar chart for sales by category and sub-category. This is where it gets a bit trickier. In order for your “Days to Show” filter to work, you must keep your Order Date field in the view. Move it to the level of detail. The result looks like this, with stacked bars for each date. I then sorted sub-category by sales descending.
Step 5 – Clean up the bar chart by removing the borders. Click on the Color shelf, then Border and choose None.

Your bar chart now looks like this:

Step 6 – Put it all together on a dashboard and add some interactivity.

Your bar chart now looks like this:

Step 6 – Put it all together on a dashboard and add some interactivity.

One additional cool benefit is that as you use the action filters (e.g., click on Envelopes), you will see the last N days based on that selection.
You can download the workbook used to create this blog post here. My next blog post will take this one step farther…calculating cumulative totals for the last N days.
Subscribe to:
Post Comments
(
Atom
)


Andy - this is a nice tip and a clever way of doing something but why not just use Relative Date or Browse Periods to do the same thing? Maybe I missed a nuance of something more specific you're trying to acheive.
ReplyDeleteAndy, relative date filters do not work well if your data is old. For example, the superstore sales data set that I have ends on Dec 31, 2012. If I use a relative date filter set to the last two weeks, I don't get any results.
DeleteYou can Anchor dates with a relative date filter. I use them in my twitter vizzes. The feature is visible when you right click on the pill in the filter shelf
DeleteAndy, I don't think this is giving the previous n days, or what people typically expect from a "show me the previous n days"-type of filter. Rather, what you are getting is the previous n occurrences where there was a sale, and some of those sales my go back weeks or months. To see what I mean, see what happens when you select Rubber Bands from the bottom visualization and notice the dates that appear in the top visualization.
ReplyDeleteGiven that we are seeing the previous n occurrences I also think displaying these as discrete dates and not continuous makes much more sense.
Finally, I instead of using last I would instead find whatever the maximum date is within the partition and subtract the number of dates from that.
Steve
Thanks for the comments Steve. Joe and I have been having the same conversation offline. In the case I was writing about, the concern was the last N occurrences so I should have been more explicit.
DeleteThis comment has been removed by the author.
DeleteNice one! 'Most Current Month' (even though the most current month isnt always this month) is pretty common.
ReplyDeleteAndy, thank you. I have a very specific need to show only the MAX date available within the dataset as it changes each day. In my case, based on the MAX Date shown, i bring back data for that day plus data for the previous day. So it's sort of like your example using LAST() < [Last N Days]
ReplyDeleteWhere [Last N Days] = 2
I can bring back last 2 days, or last 2 weeks, or last 2 months, depending on the data. This works really efficiently for showing a default view based on a dynamic "Last N". What if, however, the users also need the ability to select their own date?
Hi Andy - I need to select the Last 7 days based on the MAX(date). The date field in my data gets populated with the next day mid-day of the current day. So for instance, Today is Nov 15. If I run my report for last 7 days, I get data for Nov 9 through Nov 15. However, around 1pm, my date field gets populated with data for Nov 16. When I run my report now, I WANT to see Nov 10-Nov 16, but it shows Nov 9 to Nov 15. Just curious if you have seen something like this and perhaps have a solution. I have not been able to find a solution. Thanks
ReplyDeleteThis calculation would give you the last 7 days of sales based on a MAX(Date) field.
Deleteif [Order Date]>=DATEADD('day',-6,[Max Date]) THEN [Sales] END
How do you mix the aggregate field (MAX(Date)) and non aggregate field [Order Date]?
DeleteTom, in this case, the Max Date is a dimension coming from the database so I'm not mixing aggregate and non-aggregate dates.
DeleteAwesome use of parameters. Thanks a lot
ReplyDeleteHi Andy,
ReplyDeleteIn my case, there are more than one row for the same date (multiple timestamps per day). In that case LAST() < [Last n days] is pulling only the last 7 rows which is sometimes the same date. I would need to see all the rows for the last 7 dates. How do i achieve it ?
Thanks
Can you create a sample of the data and upload a workbook with your situation? That'll make it easier to diagnose.
DeleteAndy,
ReplyDeleteI imported only the required data(due to NDA) and uploaded it here.
https://public.tableausoftware.com/views/Book4_1252/Sheet1?:embed=y&:display_count=no
As you can updated_At field contains more than one row for the same date. Please let me know if you have any questions
Thanks
Karthik
Hi Andy,
ReplyDeleteGreat Work.
Here I have one question.I am doing table calculation to show percentage difference of Sales based on the date field.Here's the calc field which i have used
(LOOKUP(SUM( [Sales]),LAST()) - SUM([Sales] ) ) / SUM([Sales] )
I have used the last N days calc.Here my qusetion is I want to hide the last date in the view every time automatically.i.e, For example,Assume that I am showing Sales for june,july,aug,sep,oct for year 2014 and i am using the above table calc to show Percentage difference of sales compared with oct.Then, for oct it will show 0%.I don't want to show oct in the view.For this I have used the calc
LAST()-1 < [Last n months]
I had manually hided the oct month then when we type 3 in parameter control it will show last 3 month sales (july,aug,sep).Like in the same way if november sales also added into the view,I had manually hided the nov month and unhided the oct month then when we type 3 in parameter control it will show last 3 month sales (aug,sep,oct).
So for everytime when new month is added I'am doing hide manually. Is there any automation for hiding the last month sales in the view ?
Hi Andy
ReplyDeleteIf there a way to choose the last date also?
In my case my months are called periods for instance January is P1 or period 1
I have created a parameter control for all the periods (months) to filter different periods across different sheet from different data sources on my dashboard.
Now i want my graph to show last 13 periods from the selected period in the parameter.
I used the above explanation but the graph is showing me last 13 periods from the maximum period available.
Kanika, without seeing you workbook or data, my guess is that you could use a lookup function or last function and have it keep values based on that.
DeleteHi, This example helped me but I am looking to filter last N days on selection on of date in date parameter. For example I have date parameter in a calendar view, if I select today's date it should view me last 7 days, else if I select yesterday's day it should view me last 7 days from the date I have selected. Please help on working on this
ReplyDeleteThank you
I know this post was from a while back, but did you end up finding a solution to this problem? I am currently trying to do the same thing and having no luck finding answers to this question.
DeleteHi Andy,
ReplyDeleteIs there a way to re-purpose this formula this formula? I am trying to find a way to create two time periods.
1st time period - all data in the past 30 days from today
2nd time period - all data 30 days past the last date of the first time period
Please let me know.
Thanks,
Anna
Hi Anna. Try this method. LOD calcs would make this even easier.
Deletehttp://www.vizwiz.com/2014/11/kpi-and-sparkline.html
Hi Andy,
ReplyDeleteI was able to make this work for the last N days, but I was wondering if there was a way to use a date parameter to give a specific date and take the last N days from the date specified in the date parameter. Any help would be greatly appreciated!
Thanks,
Nick
Can you provide an example for last n days?
DeleteI basically copied exactly what Andy did above for his example using Last()<[Last N Days] where [Last N Days] is a parameter to just input a number to show that number of days worth of data.
DeleteSo for example, I have data with dates from 1/1/2016 all the way to 12/31/2016. I want to input 7/20/2016 in my date parameter and input 7 in my [Last N Days] parameter so I can see all my data from 7/14/2016 to 7/20/2016.
My understanding is that the Last() function only takes the last entry it can find in the data.
I was wondering if it was possible to maybe read a specific date and make that the "last" entry even if there is more data following. Or maybe there is just a completely different way of achieving this.
I do however want to keep my date parameter and Last N Days parameter to allow the user to select a specific date and the number of days worth of data they want to see.
Hi Nick. I don't exactly follow what you're asking for, but I'll give it a shot anyway. If you are wanting to only show the last N days in the view, then you could create a boolean calculation to use as a filter.
Delete0 <= DATEDIFF('day',[Order Date],[Date Parameter])
AND
DATEDIFF('day',[Order Date],[Date Parameter])<=[Last N Days]-1
Is that what you're after?
Andy,
DeleteI was wondering if I could get some assistance. I have the following case:
- I want to compare the last N days from an event this year, and also want to choose a date from the prior year, and compare the last N days prior to those events. I have the same even year to year, but the date of the event can slightly vary, and am looking to do analysis of the days leading up to that event.
Would you happen to have any suggestions on how to approach this?
Thank You,
Steven
Hi Steven. You would likely need to do this with two separate parameters, one for each event date. Then two date calculations, one for each parameter.
Delete