December 1, 2015
Dear Data Two | Week 34: Urban Wildlife

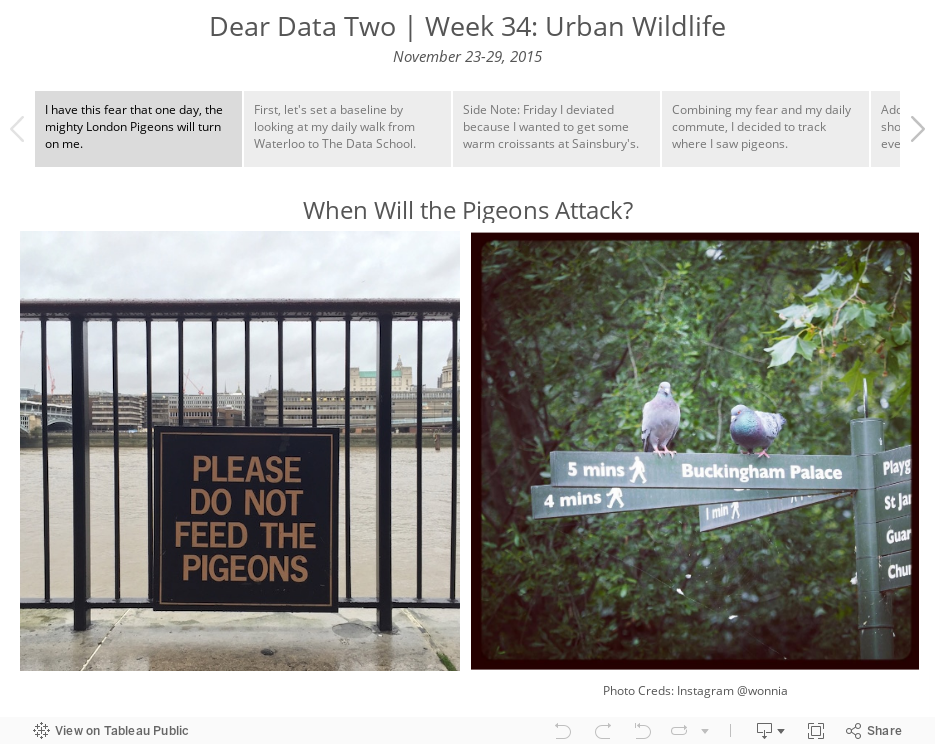
The pigeons scare the daylights out of me, but this week, I decided to note every time and place that I saw a pigeon and how they reacted to me. One interesting thing I found is that they only seem to be prevalent during the day; I only saw one all week in the evening.
After plotting them on a map, I decided to copy what one of Jeff's students did in class: create a map overlay. The postcard itself only plots the pigeon sighting (which I really like how it turned out), whereas if you add the map overlay, you then see the locations of the pigeon sighting. Great idea from UoC!!
Subscribe to:
Post Comments
(
Atom
)


No comments
Post a Comment