October 26, 2016
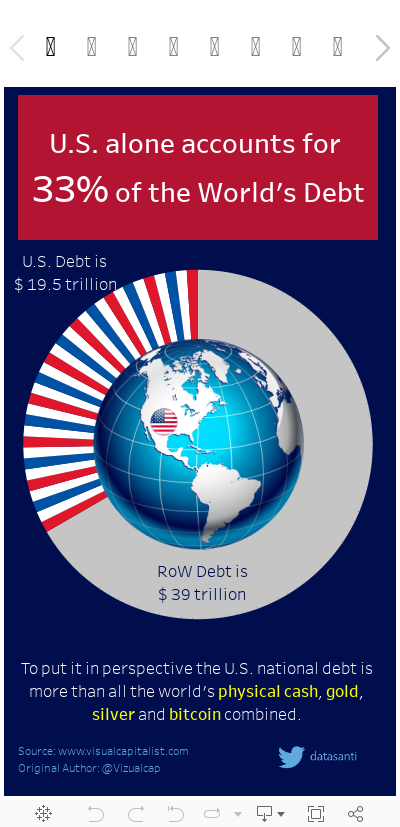
US Debt: A Makeover of a Makeover

Part of the discussion yesterday was about critiquing work others have submitted. I've shied away from this because I don't want to discourage anyone from participating. Fortunately, Santosh Patil has agreed to let me give his week 43 submission on US Debt a makeover. thanks Santosh!
Let's first look at his work:

For this makeover, I'm only going to focus on what doesn't work:
- Does it need a dark blue background? This makes some of the text hard to read.
- What are the candy stripes for on the donut chart? What value do they add other than decoration?
- What's the purpose of the globe in the middle other than decoration? What purpose does it serve?
- Overall, there's just too much going on for me, for what is essentially two data points.
Below is a ten step makeover I did of his work, starting with the original. Hopefully this helps you see how I think about data visualisation and the simplicity I think we should strive for.
Subscribe to:
Post Comments
(
Atom
)


No comments
Post a Comment