September 16, 2019
#MakeoverMonday: Committed Forever to Positive Impact Events


What works well?
- Everything looks very crisp, as it always does on Google Data Studio.
- Good filtering capability
- Allows you to explore the data in any way you desire
- Colors of the bar chart are easy to distinguish
What could be improved?
- It's way too long; I know I would never read all of it.
- The stacked bar / treemap charts things don't make sense at all.
- There's no structure to guide the user; like what is most important?
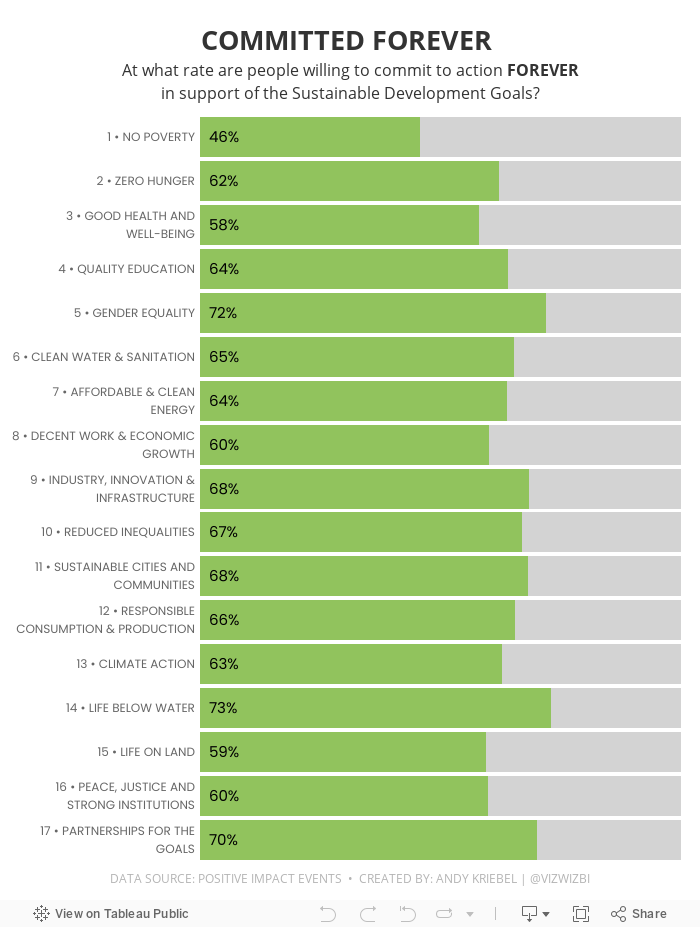
What I did
- I focused on the high-level goals.
- I noticed that there were a lot of people that said they would commit to action forever, so I made that the focus of my viz.
- I had originally split the view up by gender, but that didn't add anything to the analysis, so I took it out.
- I used the colors and fonts from the Positive Impact Events website.
And here's my makeover...
Subscribe to:
Post Comments
(
Atom
)


No comments
Post a Comment