Showing posts with label beauty. Show all posts
January 7, 2016
Dear Data Two | Week 39: Beauty
beauty
,
circles
,
color
,
Dear Data Two
,
lines
,
marks
,
shapes
2 comments

This week really helped me appreciate the exceptional beauty that is around me every day, whether it be our wonderful parks, the people I see, or the amazing architecture London offers. I had this week off from work, so I was able to spend a lot of time with my family going on walks, visiting museums, playing games, etc. So the topic, combined with the time I spent with my family, really made for a wonderfully positive week after a rather crappy Christmas week.
My analysis of the data started much like every other week: exploring what each dimension I tracked offered, looking for stories, trying to find patterns. I didn't learn a whole lot about myself, but trying to emulate what Giorgia did in her postcard for this week helped me continue to learn about using Tableau as a drawing canvas.
The trouble I run into time and time again is that I have so many dimensions that I want to put in a single view, but if I add them all in Tableau, the view quickly becomes impossible to comprehend. However, I'm really beginning to appreciate the freedom that drawing on a postcard gives me. I can incorporate as many dimensions as I'd like through the use of symbols and marks in a way that doesn't clutter the visualisation and aids in understanding.
I'm not sure why, but I feel like I'm starting to grow as a data artist, particularly when it comes to pen and paper. My ideas are flowing at the moment. Let's hope I can continue the momentum for the remaining 13 weeks.
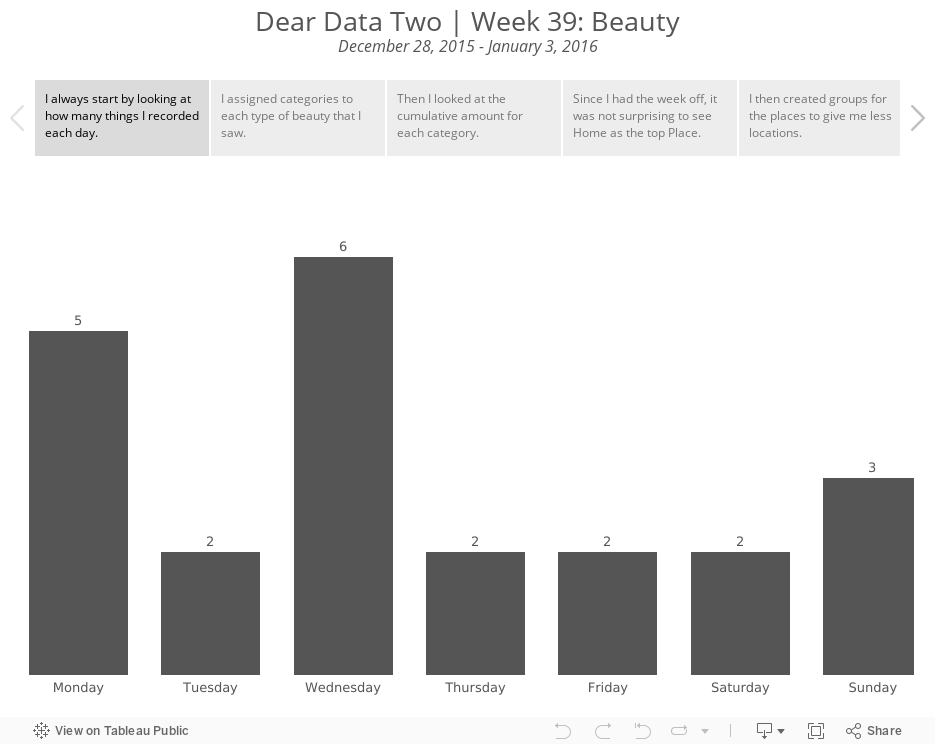
Explore my week below by click through the story points. Enjoy!
September 14, 2010
David McCandless: The beauty of data visualization
About this talk: David McCandless turns complex data sets (like worldwide military spending, media buzz, Facebook status updates) into beautiful, simple diagrams that tease out unseen patterns and connections. Good design, he suggests, is the best way to navigate information glut -- and it may just change the way we see the world.
Some quotes that stuck with me:
Pass it along!
Some quotes that stuck with me:
- Relative figures are needed to connect to other data so we can see a fuller picture that can lead to us changing our perspective.
- Data can change your perspective and change your mind midstream.
- Design is about solving problems and providing elegant solutions. Information design is about solving information problems.
- Visualizing information can give us a very quick solution to problems. We can get clarity or the answer to a simple problem very quickly.
Pass it along!
Subscribe to:
Posts
(
Atom
)






