Showing posts with label davidmcandless. Show all posts
September 14, 2010
David McCandless: The beauty of data visualization
About this talk: David McCandless turns complex data sets (like worldwide military spending, media buzz, Facebook status updates) into beautiful, simple diagrams that tease out unseen patterns and connections. Good design, he suggests, is the best way to navigate information glut -- and it may just change the way we see the world.
Some quotes that stuck with me:
Pass it along!
Some quotes that stuck with me:
- Relative figures are needed to connect to other data so we can see a fuller picture that can lead to us changing our perspective.
- Data can change your perspective and change your mind midstream.
- Design is about solving problems and providing elegant solutions. Information design is about solving information problems.
- Visualizing information can give us a very quick solution to problems. We can get clarity or the answer to a simple problem very quickly.
Pass it along!
October 9, 2009
Afghanistan Troop Deployments
afghanistan
,
barchart
,
bubblechart
,
contribution
,
davidmcandless
,
flickr
,
Guardian
,
military
,
war
No comments
My favorite bubble man uploaded another doozy. This time he's displaying troop deployments to Afghanistan.

The first message that the bubbles are trying to communicate is simply the number of troops deployed.
I can see why he has the bubbles across the top; they're in a neat ascending order, but then the US is show below all of the other countries? Why aren't they all arranged together?
Also, what is the purpose of having all of the other types of "troops" on the chart? Finally, there is one pretty big issue with the data; where are all of the other countries that have sent troops?
Bubbles are a poor method of showing relative size. A simple bar chart works much better. Unlike the author, I have included "all other" countries.

The second message, which I cannot make heads or tails of, is the number of troops per million of the population. What is the purpose of this data and what insight can you possibly gain from it?
When I first saw this chart, I immediately tried to connect the bubbles at the top to the bubbles at the bottom, but it's impossible.
The title of the second chart is "Which countries have sent the most troops?" Ok, one more time, how could anyone possibly answer that question based on the troops per million of the population?
When I saw the question, I immediately though of a bar chart showing the percent of the total troops that each country has sent. I created this visualization below and added color to emphasize those countries that have more skin in the game.
From my visualization, you can see that the US has sent about 47% of the troops. In the bubble chart, I see the number 98. Which one do you think answers the question more appropriately?

If you really want to get sick, check out the rest of the author's bubble charts on this topic. I don't get the fascination with the bubbles...
* Data courtesy of The Guardian DataBlog
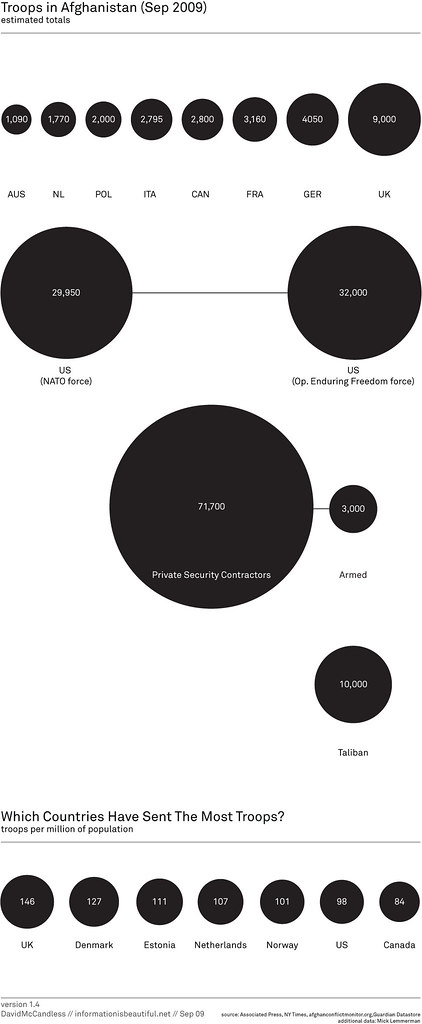
The first message that the bubbles are trying to communicate is simply the number of troops deployed.
I can see why he has the bubbles across the top; they're in a neat ascending order, but then the US is show below all of the other countries? Why aren't they all arranged together?
Also, what is the purpose of having all of the other types of "troops" on the chart? Finally, there is one pretty big issue with the data; where are all of the other countries that have sent troops?
Bubbles are a poor method of showing relative size. A simple bar chart works much better. Unlike the author, I have included "all other" countries.
The second message, which I cannot make heads or tails of, is the number of troops per million of the population. What is the purpose of this data and what insight can you possibly gain from it?
When I first saw this chart, I immediately tried to connect the bubbles at the top to the bubbles at the bottom, but it's impossible.
The title of the second chart is "Which countries have sent the most troops?" Ok, one more time, how could anyone possibly answer that question based on the troops per million of the population?
When I saw the question, I immediately though of a bar chart showing the percent of the total troops that each country has sent. I created this visualization below and added color to emphasize those countries that have more skin in the game.
From my visualization, you can see that the US has sent about 47% of the troops. In the bubble chart, I see the number 98. Which one do you think answers the question more appropriately?
If you really want to get sick, check out the rest of the author's bubble charts on this topic. I don't get the fascination with the bubbles...
* Data courtesy of The Guardian DataBlog
October 5, 2009
Follow up: Evolution of the Ozone Hole
bubblechart
,
davidmcandless
,
flickr
,
Guardian
,
ozone
,
pollution
,
tableau
1 comment
You know, I really love it when people discuss issues and share solutions. Joe Mako and I had a great discussion on my last two posts regarding the most effective visual representation of the ozone hole over time. Joe create an OUTSTANDING representation of the data using floating bars.

Joe created this visual using Tableau. I had not seen anyone do this in Tableau before. I had thought about doing stacked bars and making the lower of the two bars white, but this is way better. Joe has also provided the Tableau Packaged Workbook. I have posted this on a Google Group that I just created.
Thanks Joe! Excellent work!
Joe created this visual using Tableau. I had not seen anyone do this in Tableau before. I had thought about doing stacked bars and making the lower of the two bars white, but this is way better. Joe has also provided the Tableau Packaged Workbook. I have posted this on a Google Group that I just created.
Thanks Joe! Excellent work!
Size Evolution of the Ozone Hole
bubblechart
,
davidmcandless
,
flickr
,
Guardian
,
ozone
,
pollution
2 comments
Joe Mako left a comment on my previous post critiquing the use of bubbles to represent the size evolution of the ozone hole. I agree with what Joe said: "a bar or line would have been better." The only problem with using a line is that there is not a consistent time measure (1996 throws it off...yes I know, a minor issue).
So I recreated the data with two bar charts. (1) Representing the actual values and (2) the change from the previous measure. I like (1) better. How about you?

So I recreated the data with two bar charts. (1) Representing the actual values and (2) the change from the previous measure. I like (1) better. How about you?
October 4, 2009
Quick, help save the bubbles
bubblechart
,
davidmcandless
,
flickr
,
Guardian
,
ozone
,
pollution
1 comment
Someone, please help explain this to me. There is no legend to reference the colors, the data, nothing.
Why 1996 instead of 1995? What do the numbers represent? What do the colors signify? Why is the last bubble green instead of hot pink?
If the dark grey in the middle four circles represents the ozone hole and the total size of the circle is earth (which I can only assume), then I think it's a poor representation of the problem. Is the ozone layer really that huge? No, it's not.
Please someone, save me! No wait, don't save me, save the bubbles!

Why 1996 instead of 1995? What do the numbers represent? What do the colors signify? Why is the last bubble green instead of hot pink?
If the dark grey in the middle four circles represents the ozone hole and the total size of the circle is earth (which I can only assume), then I think it's a poor representation of the problem. Is the ozone layer really that huge? No, it's not.
Please someone, save me! No wait, don't save me, save the bubbles!

October 1, 2009
Pop the Afghanistan War Bubbles
afghanistan
,
barchart
,
bubblechart
,
davidmcandless
,
flickr
,
Guardian
,
military
,
war
No comments
Flowing Data had a post today listing resources to find data. One of these sources was the Guardian Datablog.
The image below caught my eye. It's from a Flickr pool for the Guardian datablog.

The author's says "Latest military casualty figures in proportion to each force's troop numbers. I think this gives a clearer sense of which armies are taking the most flak."
Ok, I get the intent, but why the bubbles? Doesn't a simple bar chart provide a much simpler method for communicating the data?

Here's what I see in the data: the US provides the bulk of the forces, but loses the fewest casualties as a percentage of the total force. It's known across the world that the US military is one of the most prepared, so this shouldn't surprise anyone. I don't see any enlightening information in the author's analysis, other than simply giving us a pretty report.
The image below caught my eye. It's from a Flickr pool for the Guardian datablog.

The author's says "Latest military casualty figures in proportion to each force's troop numbers. I think this gives a clearer sense of which armies are taking the most flak."
Ok, I get the intent, but why the bubbles? Doesn't a simple bar chart provide a much simpler method for communicating the data?
Here's what I see in the data: the US provides the bulk of the forces, but loses the fewest casualties as a percentage of the total force. It's known across the world that the US military is one of the most prepared, so this shouldn't surprise anyone. I don't see any enlightening information in the author's analysis, other than simply giving us a pretty report.
Subscribe to:
Posts
(
Atom
)






